Modern mouth bar dataset
Mouth bar data
The modern mouth bar dataset offers valuable information on the sizes and shapes of shallow portions of mouth bar deposits, termed Mouthbar Element Complexes (MB EC).
Mouth bar bodies are mapped through careful examination of historical aerial imagery.
Note that the dimensions provided reflect only the shallow portions of mouth bars, or those portions of mouth bar deposits that can interact with wave breakers. The true three-dimensional size of these deposits would be larger if we also account for the downdip extent of these deposits that occurs below sea level.
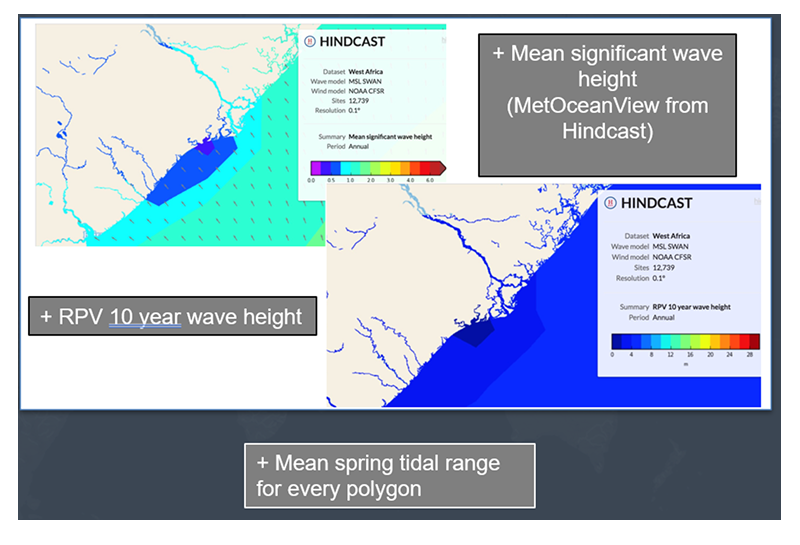
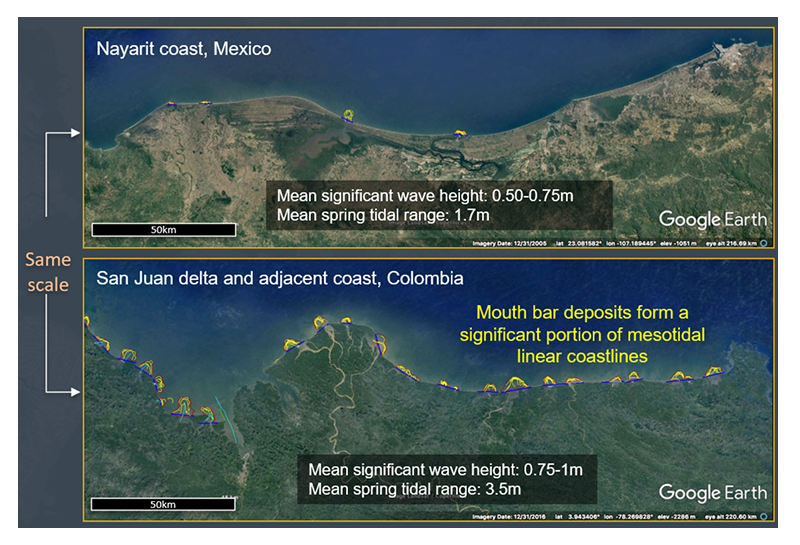
The illustration below provides an example of how the dataset can be used for analogue and dimensional analysis. Metadata collected for each mouth bar polygon includes associated mean wave height and estimated spring tidal range.
The two systems shown are affected by similar wave heights but exhibit very different tidal ranges. It is clear that the lower system, influenced by larger tides, features a much more prominent mouth bar component in its depositional architecture. As a result, it is associated with higher levels of heterogeneity.
Querying the data included in Sedbase can generate summary statistics on the lateral extent of the shallow portions of mouth bar deposits, as well as their typical alongshore spacing.
Overview of measurement methodology
-
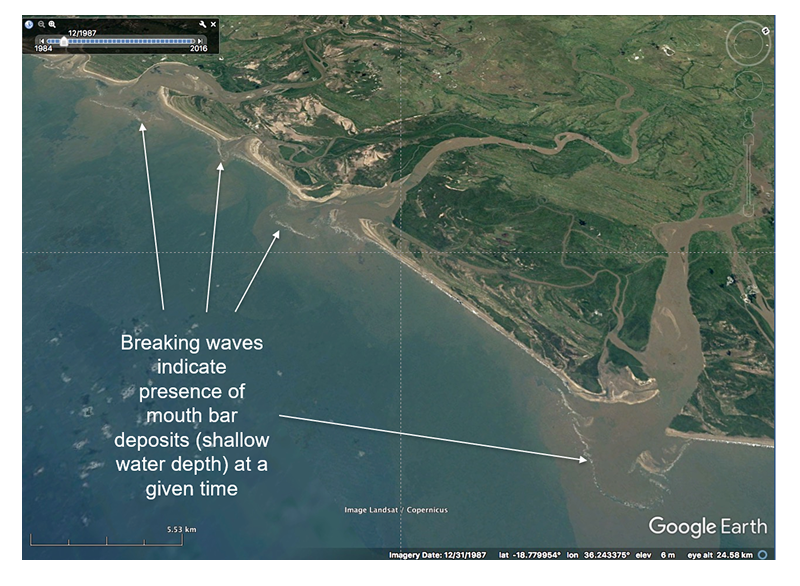
Shallow portions of mouth bar deposits are identified by observing wave breaker zones.
-
Historical aerial imagery is used to map the positions of wave breakers over time. These breaker zones are compiled into a breaker zone map (bottom right), which displays all identified breaker positions over a period typically spanning 30 years, depending on location and data availability.
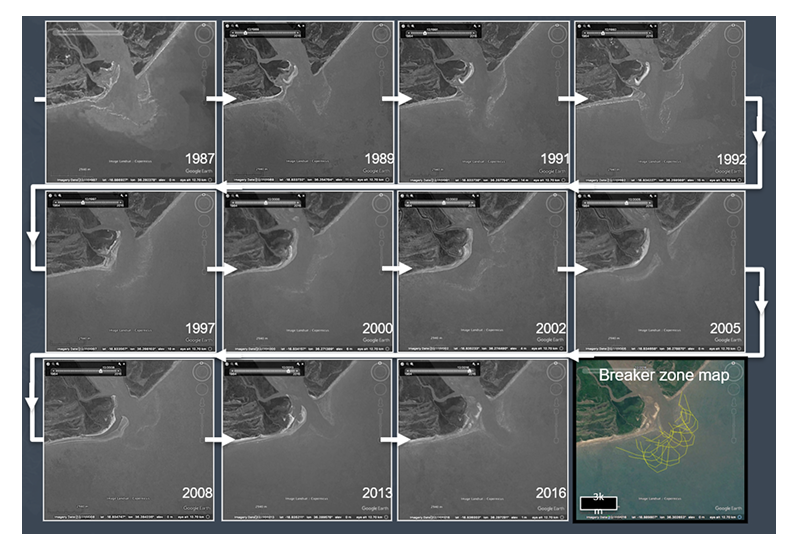
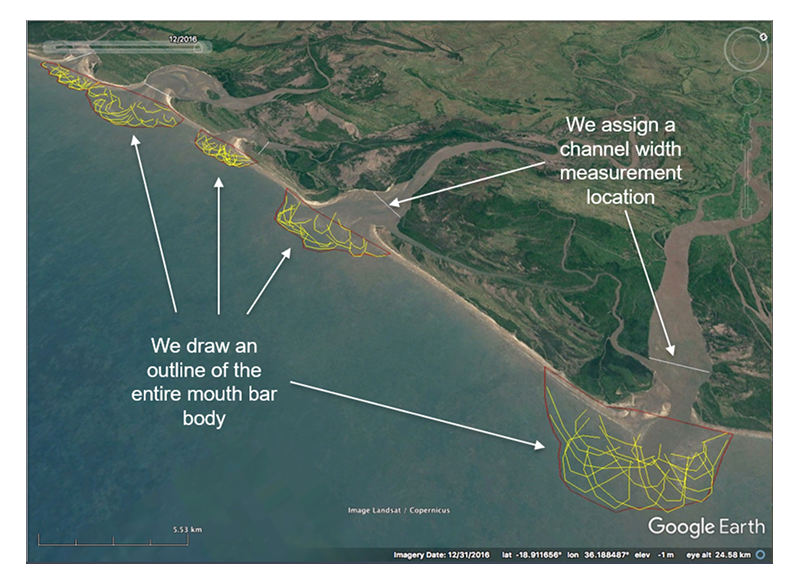
These breaker zone maps serve as proxies for the distribution of the shallow portions of a system’s mouth bar deposits. Mouth bar polygons are sketched based on the shape and extent of the breaker zones.
Parameters measured
-
We measure the width of the feeder channel for each mouth bar at a location that remains relatively stable over the observed time period. These measurement points are not always located at the shoreline, as that area often changes rapidly over such timescales.
-
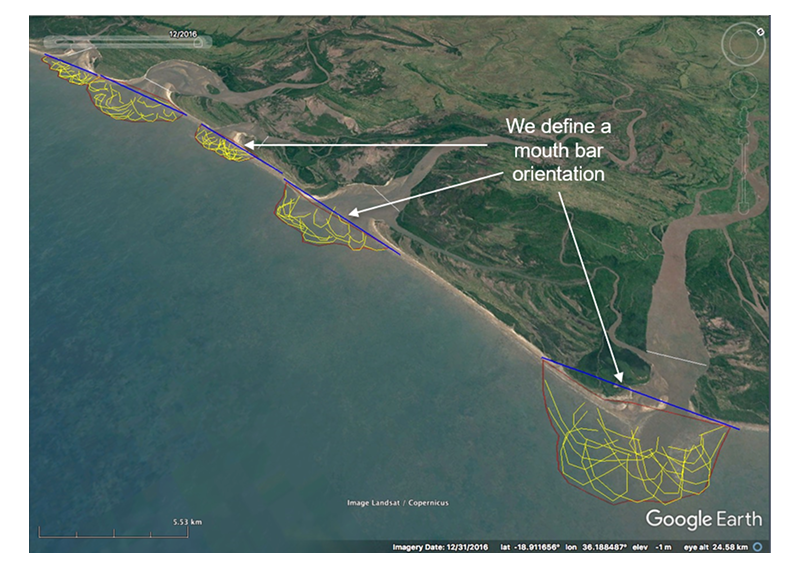
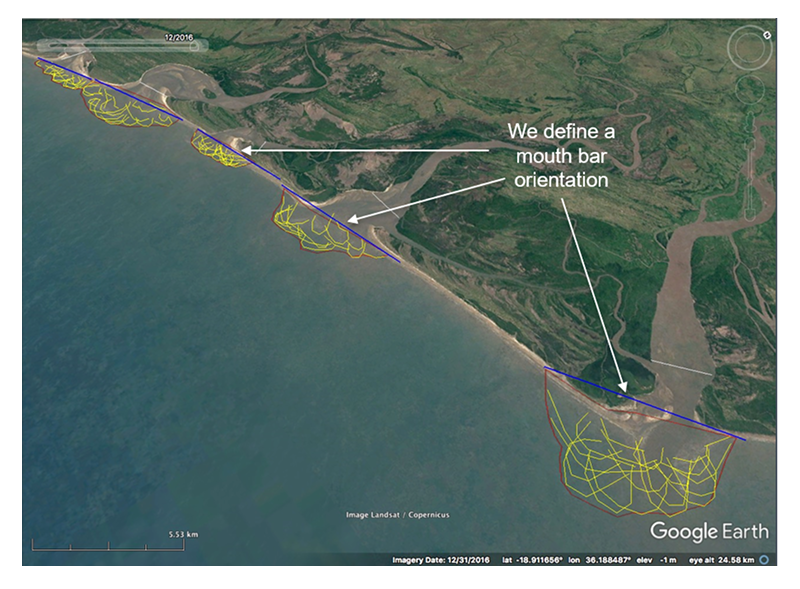
We also determine the local shoreline trend for each mouth bar deposit, enabling analysis of mouth bar orientation relative to the shape of the adjacent coastline.
-
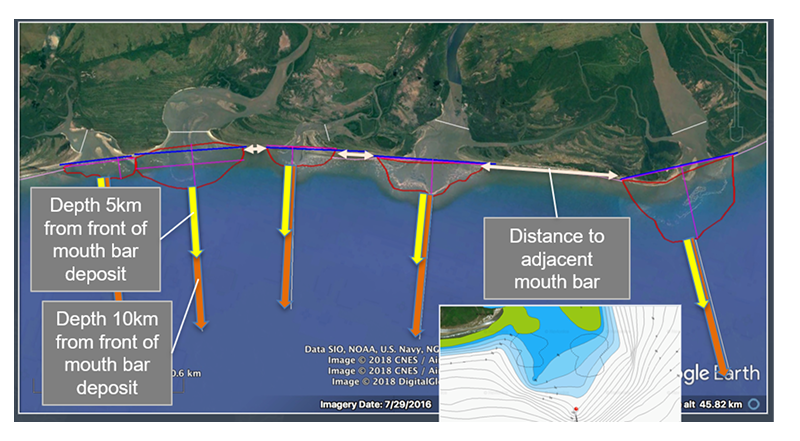
Once the mouth bar polygons are mapped, we measure their dip extent, strike extent, the width of the associated channel, and the angle between the channel and the local shoreline trend. The figure illustrates the measurement methodology, with all measurements performed manually.
In addition to the measurements described above, we also record the distance between adjacent mouth bar polygons, as well as the local water depth at 5 km (yellow arrow) and 10 km (orange arrow) in the down-dip, seaward direction from the most seaward extent of the mapped polygons. Most mouth bar deposits terminate before reaching these depths.
These water depth measurements can serve as a proxy for the local vertical thickness of the entire mouth bar package. For instance, if the water depth 10 km seaward is 10 m, the three-dimensional thickness of the mouth bar package is likely less than 10 m. Accordingly, the parasequence formed by progradation of this deposit would also be expected to have a thickness of less than 10 m.
The dataset also includes metadata about mean significant wave height and approximations of tidal range.