Introduction
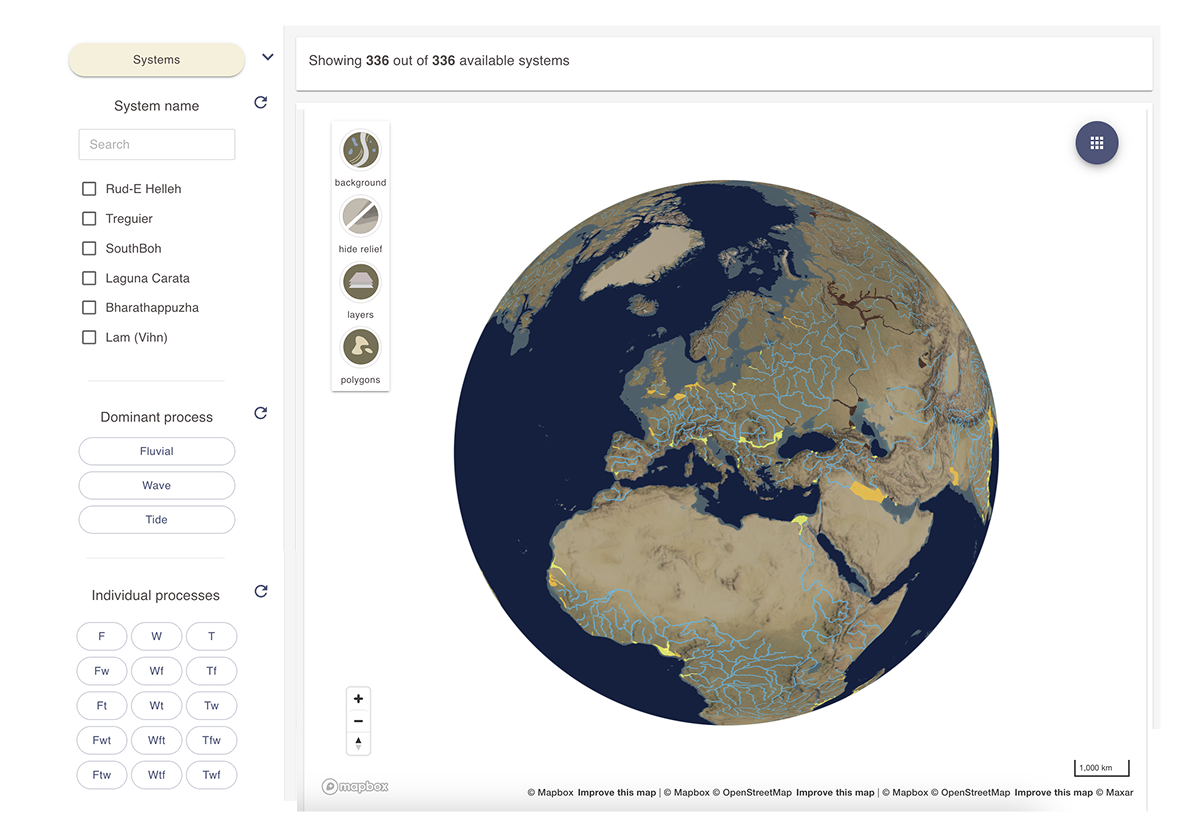
Use the View analogue and dimensional data dashboard to find analogues and dimensional data from a wide range of shallow marine and fluvial environments.
Explore analogues at both regional system scale and individual unit scale—such as channels, channel belts, and mouth bars
All data can be viewed on interactive maps. Quantitative data can be analyzed via interactive histogram, box plot, and scatter plot charts.
Main Practical Uses
Use depositional analogues to:
Study the natural variability of depositional systems in plan view based on environments identified in the subsurface.
View analogues from similar tectonic basin types and basin physiographies to improve predictions of depositional architecture at both local and regional scales.
Strengthen your understanding of how depositional processes influence resulting depositional architectures.
Examine the relationship between drainage basin characteristics, the character of water basins, and the depositional processes active at the coastline.
Use analogues to build more realistic conceptual models for your subsurface interval, supporting more informed static and dynamic modeling decisions.
Use dimensional data to:
Obtain shape and dimensional data for object modeling of channelized and mouth bar–bearing intervals in the subsurface.
Get information on typical length scales of these deposits to support well correlation and modeling efforts.
Relate depth of progradation, derived from mouth bar sediment body parameters, to the thickness of subsurface deltaic coarsening-upward successions, and refine data queries to target appropriate systems.
What You Need to Know
- Analogues may represent regional depositional systems with mapped geomorphology or specific architectural units derived from those maps.
- You can locate specific analogues by applying filters in the side menu of the dashboard. These filters execute search queries on the related analogue metadata.
- Architectural units analogues include dimensional data, which can also be examined using the interactive charts available for numerical fields.