Interpret environments based on process
Interpret local depositional environments in core based on your assessment of fluvial, wave, and tidal processes.
Enter your process observations using the appropriate filters to view suggested interpretation results. These can be further refined using additional observations and facies models.
How does it work?
The process filters use a rule-based system to connect process inputs to possible Element Complex (EC) interpretations.
The interpretation results can support the development of depositoinal conceptual models for the subsurface interval and inform static modeling decisions.
Practical Uses
Identify the range of possible local depositional environments (EC Categories) based on observed processes.
Explore alternative depositional scenarios that may have been overlooked in previous assessments and assess uncertainty.
Use interpretation results to guide predictions about potential parent depositional environments and possible architectures in unsampled areas beyond cored wells.
Skills required
- Identification of maximum transgressive and maximum regressive surfaces
- Identification of Element complex (EC) boundaries
- Determining relative importance of fluvial, wave and tide process in a core interval
- Determining relative percentages of fluvial, wave and tide facies in a core interval
How to applying process filters
Depositional process filters can be applied by (1) selecting process categories manually, (2) determining process percentages, or (3) answering questions about relative process importance. You can combine the three approaches for a more tailored interpretation.
The process filters in the dashboard should only be used after you have evaluated processes based on core observations.
Click a tab below to view the procedure for each selection type:
- Manual Selection
- Determine Process Percentages
- Relative Process Importance
-
Open the Characterize Environments dashboard.
-
In the filter sidebar, locate the Classify by Identifying Depositional Processes filter section.
-
Use the Select individual processes filter to choose one or more process categories.
-
Click on one or more process buttons and observe how the display area on the right updates.
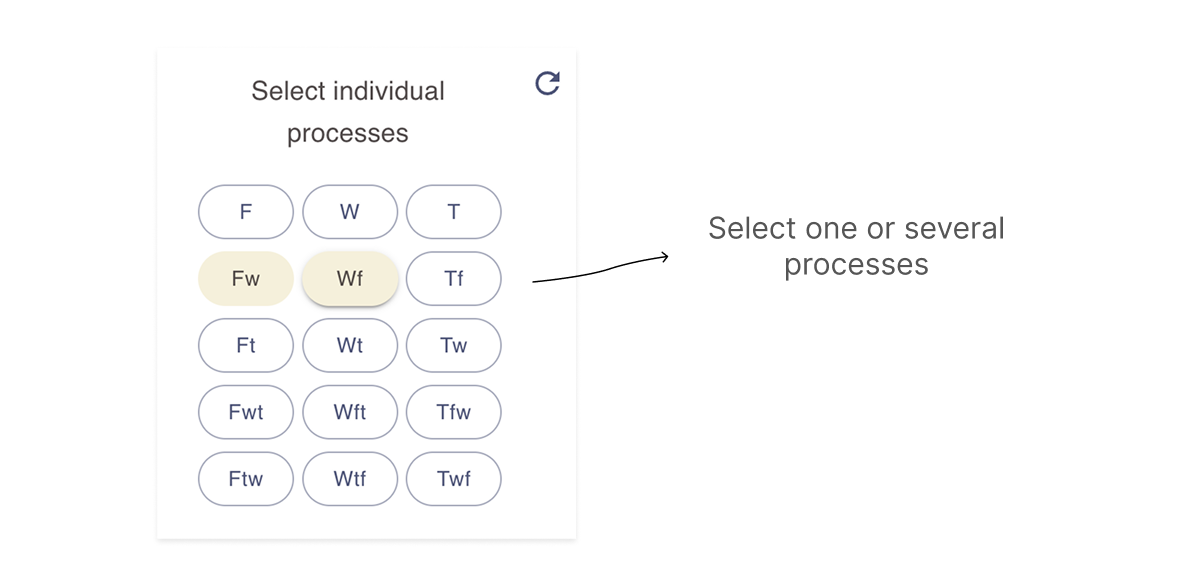
You can also click directly on process fields in the ternary plot to add or remove selections. For guidance on using the results display area, see the View environment category results page.
-
Open the Characterize Environments dashboard.
-
In the filter sidebar, locate the Classify by Identifying Depositional Processes menu.
-
Use the Measure relative process percentages filter to enter the process percentages for the Element Complex (EC) interval. Percentages must total no more than 100; exceeding this limit will trigger an error.
-
After entering the percentages, view the updated results in the display area on the right.
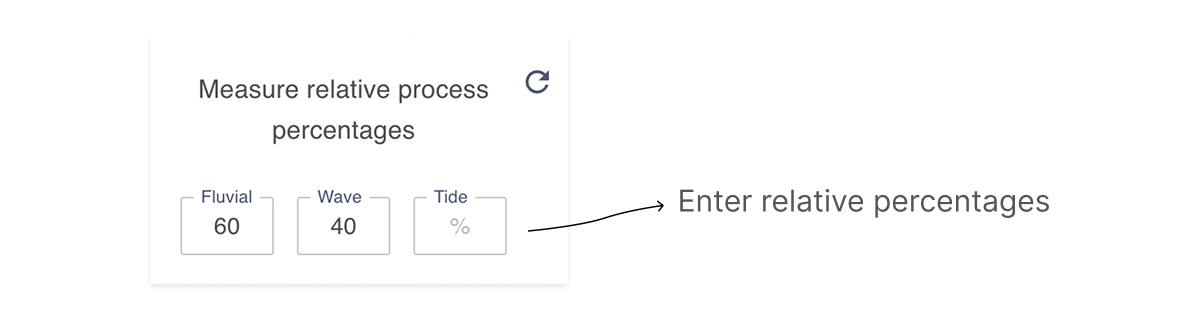
For guidance on using the results display area, see the View environment category results page.
-
Open the Characterize Environments dashboard.
-
Locate the Classify by Identifying Depositional Processes menu in the filter sidebar.
-
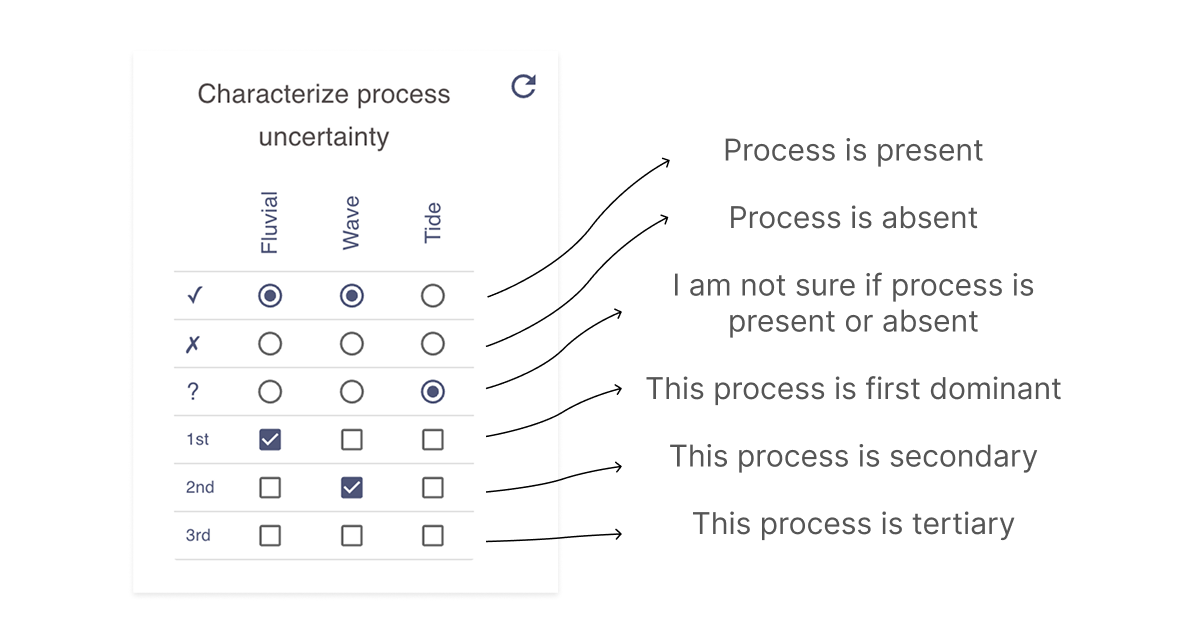
Use the Characterize process uncertainty interactive filter to describe the relative proportions of processes for the Element Complex (EC) interval. Use the image below as a guide for now the interactive form should be used.
-
After entering your input, view the updated results in the display area on the right.
For guidance on using the results display area, see the View environment category results page.
Combining process filters with other filter types
When you apply filters from multiple sections in the Characterize Environments dashboard, the results displayed will reflect only the categories common to all selected filters.
View and modify depositional environment results
The results display in the Characterize environments dashboard in shared by depositional environment interpretation filters. Open the View and modify environment category results page for more information the results area.