View and modify environment category results
The main display area of the Characterize Environments dashboard allows you to:
-
View results based on selected filters in the sidebar.
-
Make interactive input selections.
-
Modify results.
-
View prediction outputs.
The display area contains:
- A summary card showing counts of active filters and interpretation results.
- An interactive ternary plot for viewing and adjusting process-based results.
- An interactive Element complex (EC) results section with both pie chart and grid views,
- Integrated functionality for predicting parent regional depositional systems (ECA), and sibling ECs.
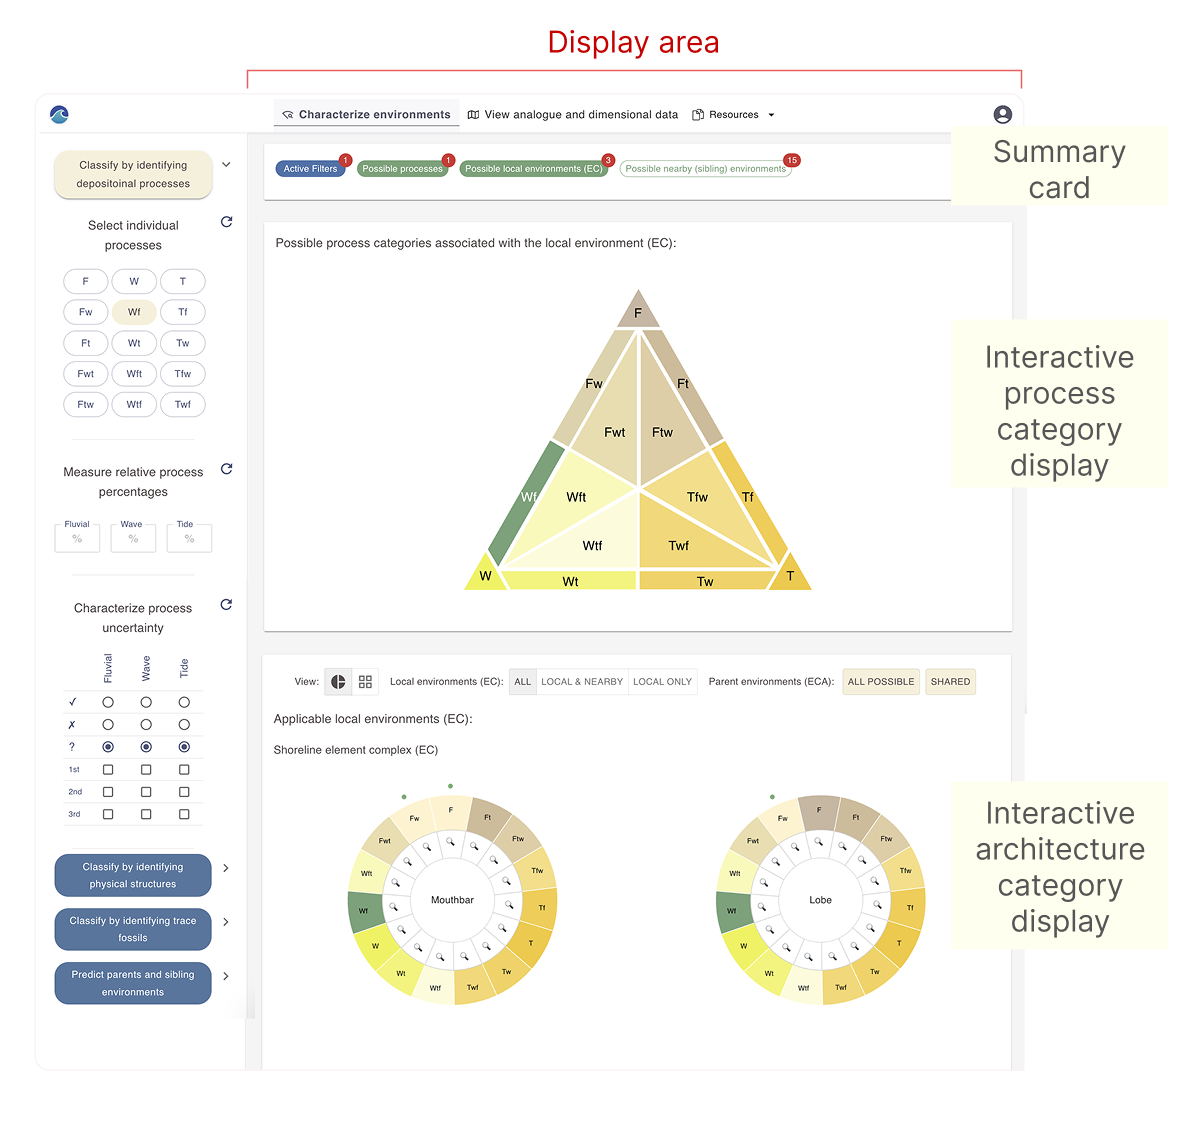
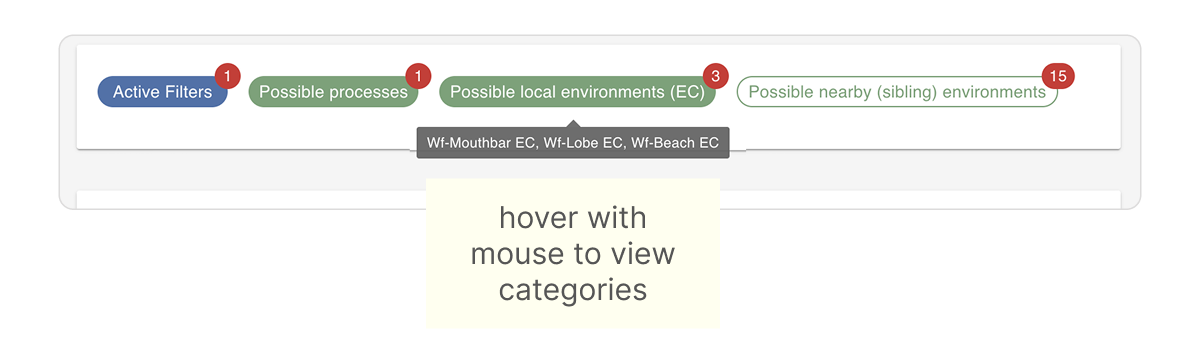
Summary card
Use the summary card to track the number of applied filters, user selections, and interpretation results.
Hover over each value to view a quick summary of the corresponding results.
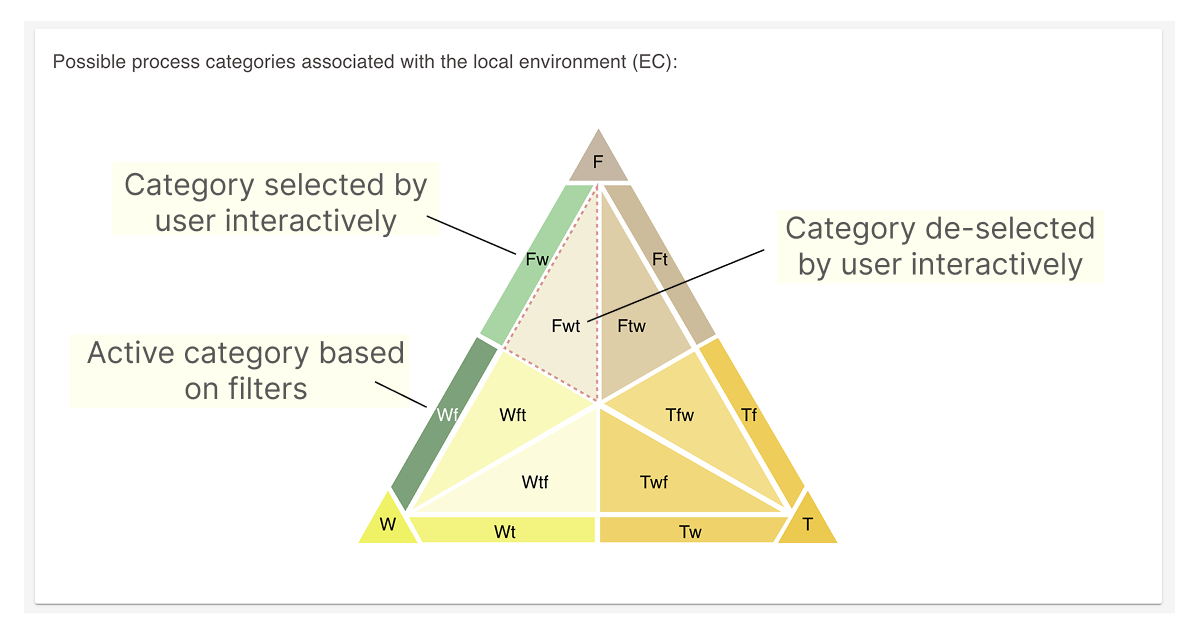
Ternary process plot
The process ternary plot displays process categories suggested by Sedbase based on your filter inputs and allows for additional user input.
You can use the plot to add process categories beyond those suggested or remove categories from the suggested list.
All changes are reflected in the summary card and will dynamically update the Element Complex (EC) interpretation results.
Hover your mouse to see the current state of a process fields
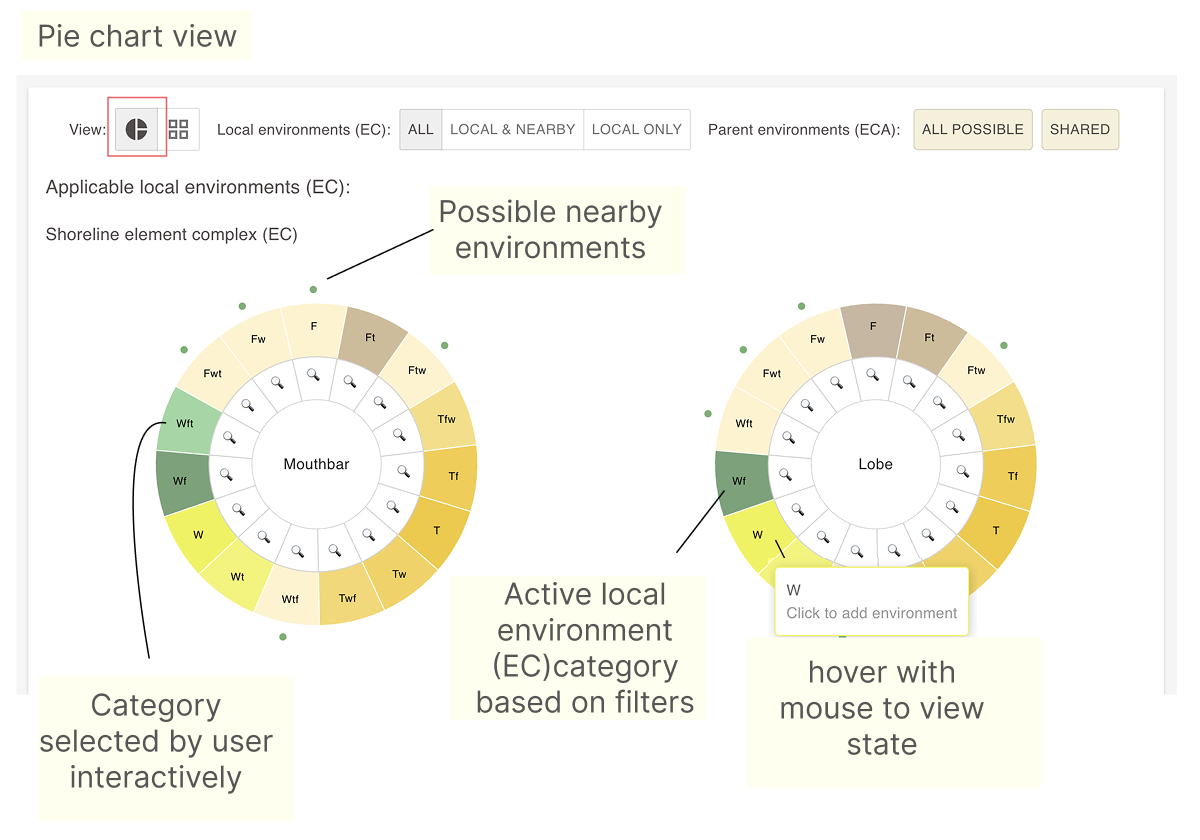
Interactive Element complex (EC) results section
Use this section to view the Element complex (EC) results based on your filter inputs.
Results can be displayed in the default pie chart view, which groups ECs by type, or in the grid view, where each EC is shown individually with an accompanying icon.
Each EC category field in the pie chart and grid view is interactive—click to add it as a user-selected input or to remove it from the list.
Refer to the illustration below to become familiar with the top menu of this section.
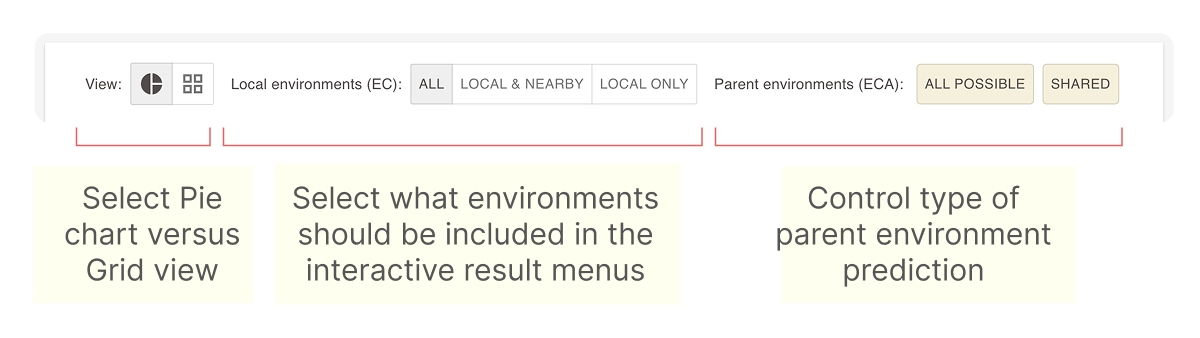
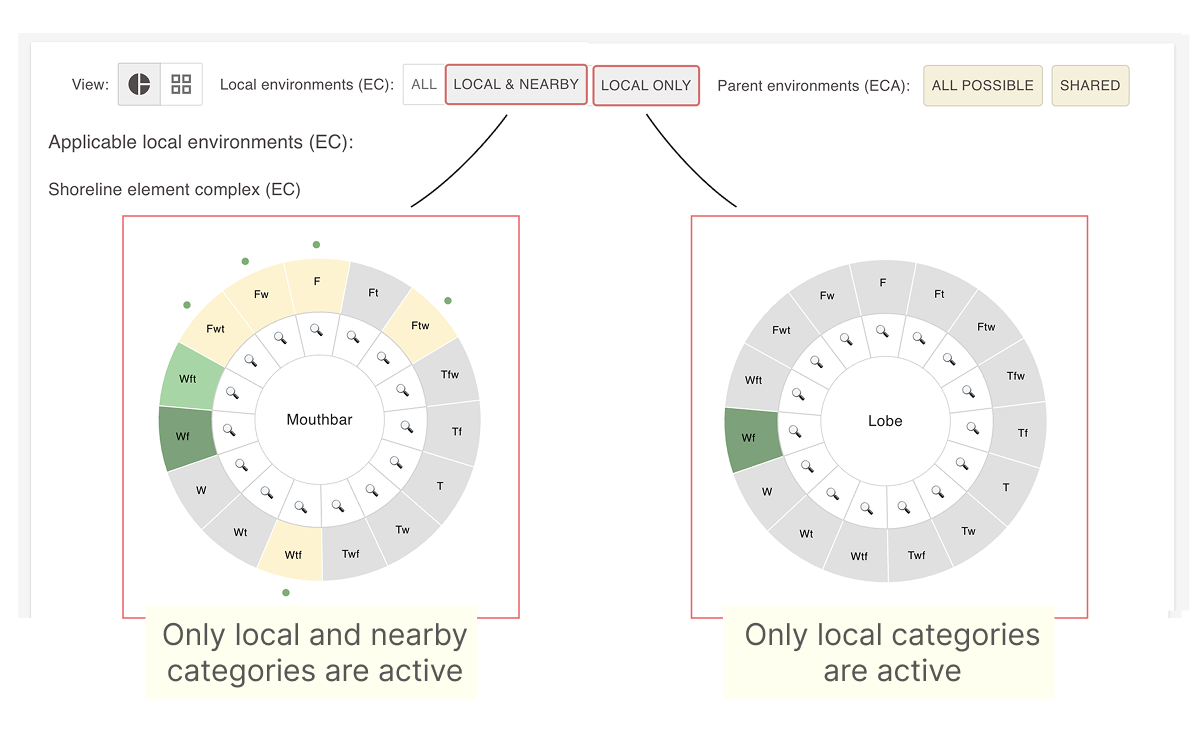
Working with the pie chart view
Use the pie chart view to explore Element Complex (EC) results, with a focus on EC types (e.g., Mouthbar).
The pie chart displays:
- Results based on selected filters
- Additional EC categories selected by the user
- EC categories removed by the user
- Sibling EC categories (see Predict local environments between wells)
Hover over any field to see its current status.
Note difference when clicking on LOCAL & NEARBY and LOCAL ONLY view buttons.
Working with the grid view
Use the grid chart view to focus on individual EC categories and to see display icons, which help visualize the type of feature represented.
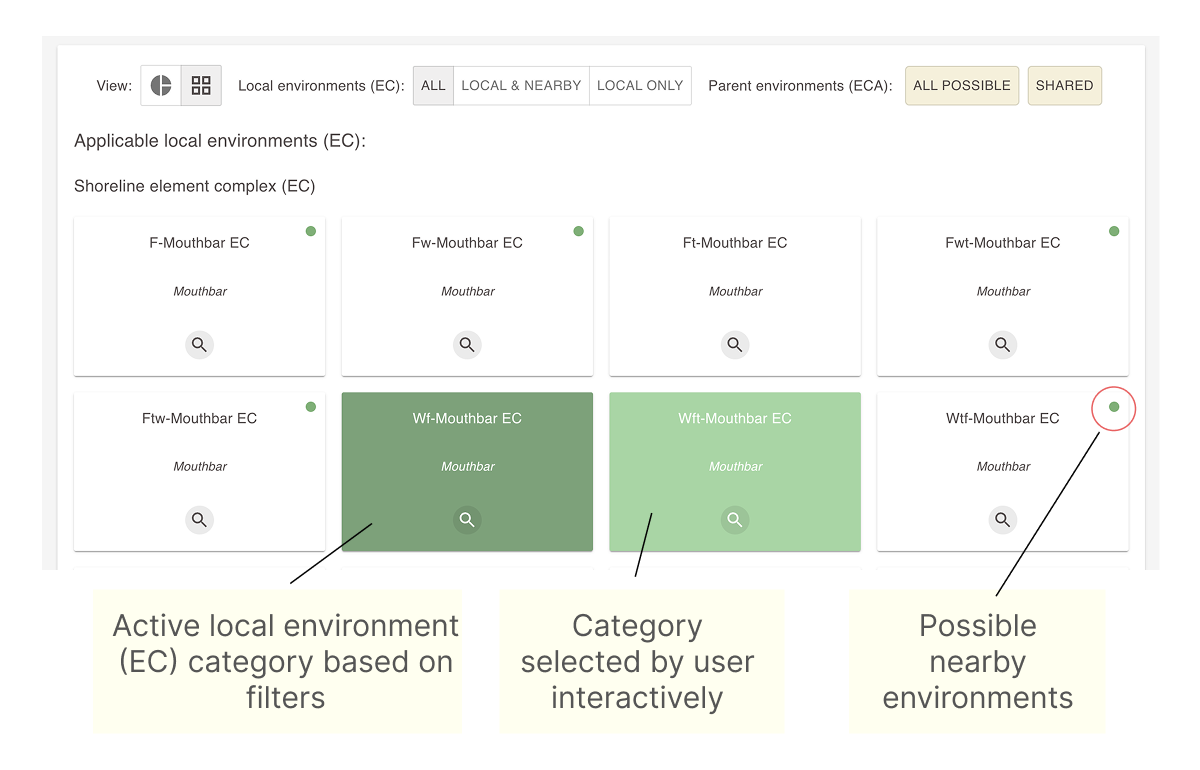
The Pie chart and Grid views share the same state, so feel free to alternate between them.
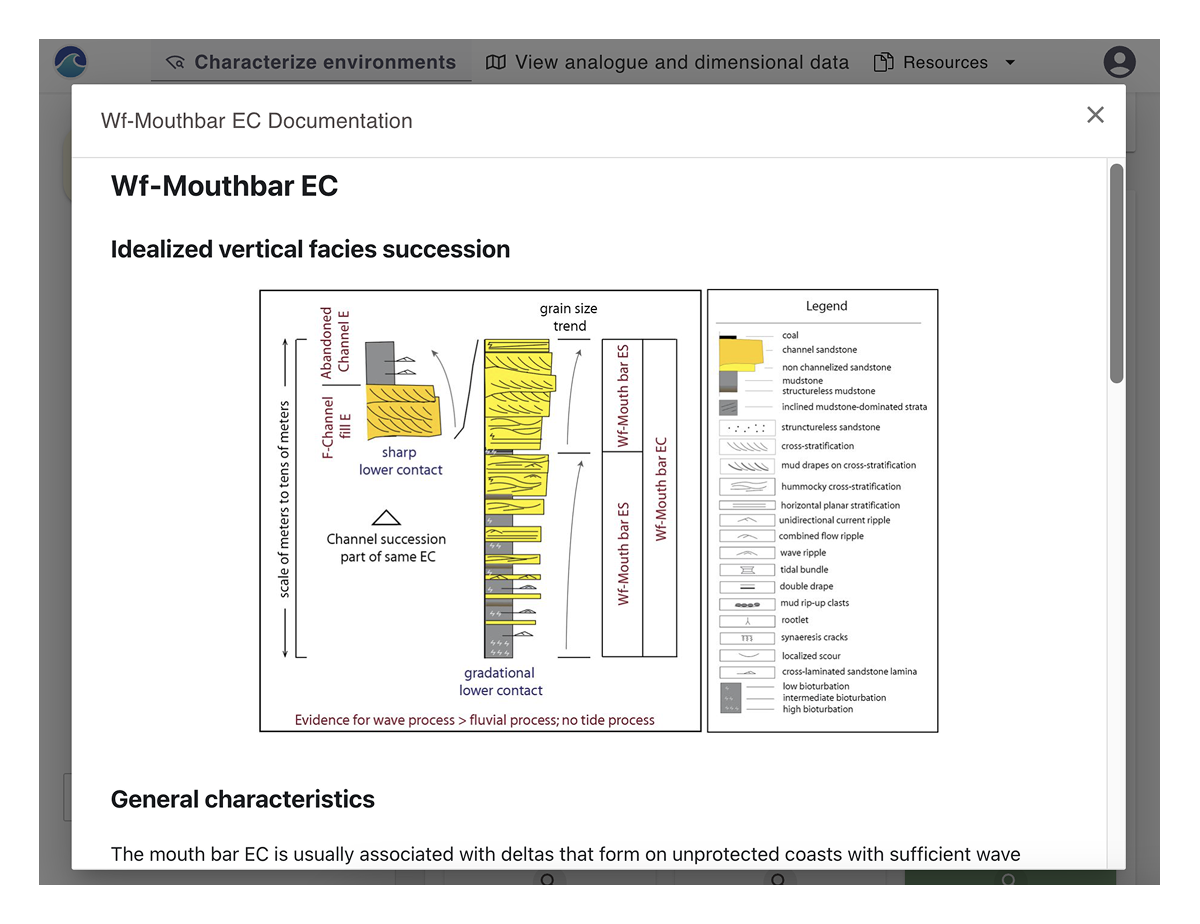
View our integrated facies models
Click the hand lens icon in either the pie chart or grid view to open a pop-up window showing the facies model for the selected EC.
Use facies models to refine filter-based results—for example, by removing categories that do not apply.
Predict parent and sibling architecture.
Refer to the pages below for information on using the integrated parent depositional environments (ECA) and nearby local environments (EC) prediction tools.