Predict local environments between wells
The Characterize environments dashboard includes integrated tools for predicting possible local environments that may be present in unsampled, inter-well areas.
These predictions identify potential additional local environments based on available data and are meant to highlight the depositional uncertainty that should be accounted for in subsurface modeling. Where applicable, use additional observations to refine the list of possible environments.
How does it work?
Predictions of local environments are based on a two-step process performed for you by Sedbase:
- First, all valid regional parent depositional environments (ECA) are identified. This is based on the principle that only a limited number of valid parent–child relationships exist between child EC and parent ECA units.
- Next, all possible child ECs associated with the identified parents are retrieved. These represent potential sibling EC environments—i.e., environments that could exist within the same depositional system is association with the already interpreted environments in wells.
Practical uses
Consider different local depositional scenarios that may affect inter-well architecture.
Make better predictions about potential compartmentalization and heterogeneity issues resulting from unexpected architectures between wells.
Inform decisions about favorable or unfavorable modeling scenarios.
How to view regional parent environment predictions
-
Make sure that at least one Element complex (EC) is shown as a filter result or has been user-selected.
-
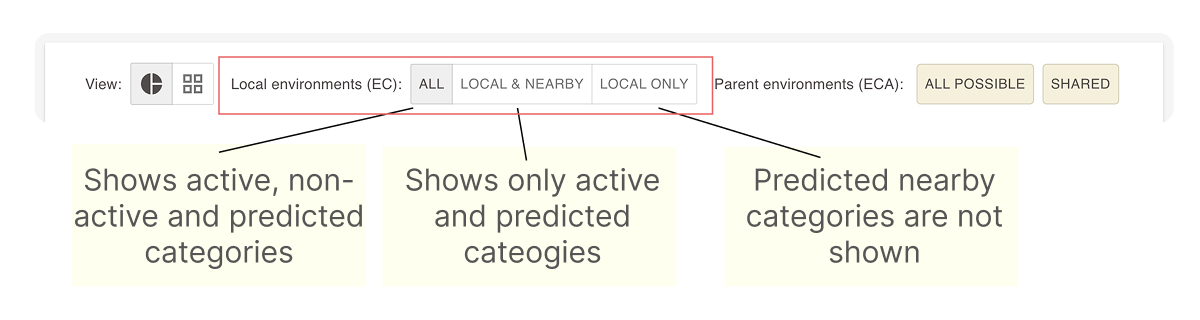
Locate the three buttons next to the Local environments (EC) label in the top menu of the EC categories section and choose your preferred view mode:
ALL - This is the default view, which keeps all Element Complex (EC) fields active. Predictions about nearby environments are indicated by red circles.
LOCAL & NEARBY - This mode deactivates EC fields that are not primary selections or nearby predictions in pie chart view, or hides them entirely in grid view.
LOCAL ONLY - This mode displays only the EC results from filters and active user EC selections, hiding all predictions of nearby environments.
-
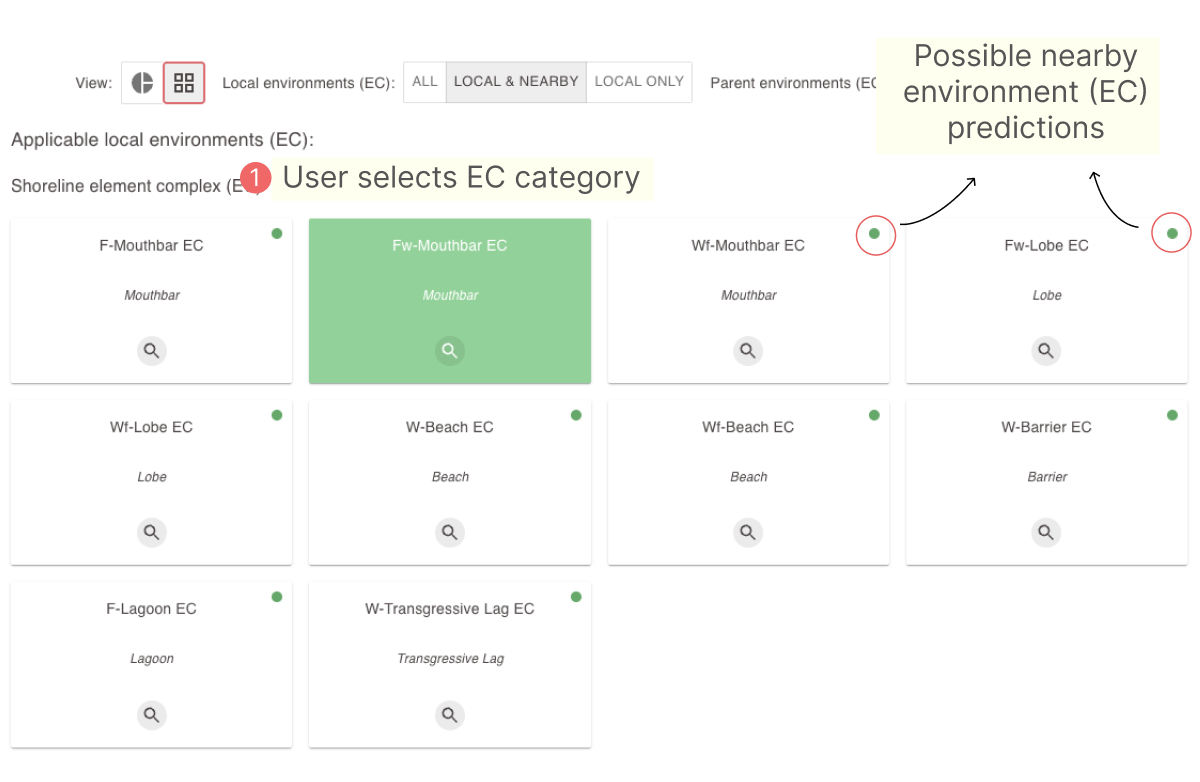
Select ALL or LOCAL & NEARBY to view possible nearby environment predictions. Predicted categories are indicated by the green dots.
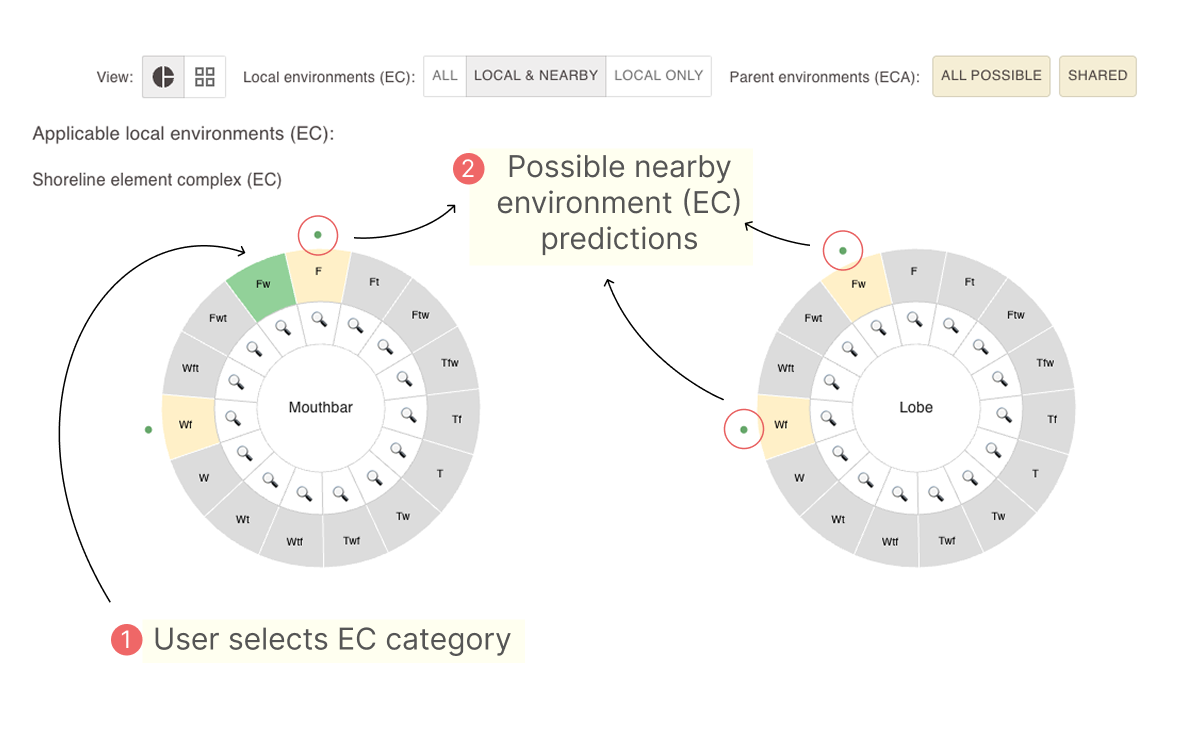
-
Switching to the Grid view shows the same results. Predicted categories are also indicated by the green dots.