Find channel belt analogues and dimensional data
Identify modern channel belt analogues based on shape, width, and parent depositional system characteristics. Analyze their morphology and variability—both within individual systems and across multiple systems—to better inform subsurface correlation and modeling of channelized intervals.
Obtain planform channel belt width and shape data in relation to parent system parameters and other relevant criteria.
Practical Uses
When using mapped channel belts as depositional analogues:
When using channel belt dimensional data:
Learn about the datasets:
Find out about how the modern channel belt dataset was collected.
What you need to know
- Dimensional and shape data for channel belts deposits is derived from mapped polygons based on underlying geomorphological data.
- Channel belt dimensional data are generated by a proprietary algorithm that analyzes the polygon shape, identifies a centerline, ignoring significant shape irregularities, and then subdivides the interval into segments perpendicular to this line. The sinuosity measurement is based on the shape of the center line.
Find modern channel belt analogue and dimensional data by using filter menus
- Open the View analogue and dimensional data dashboard.
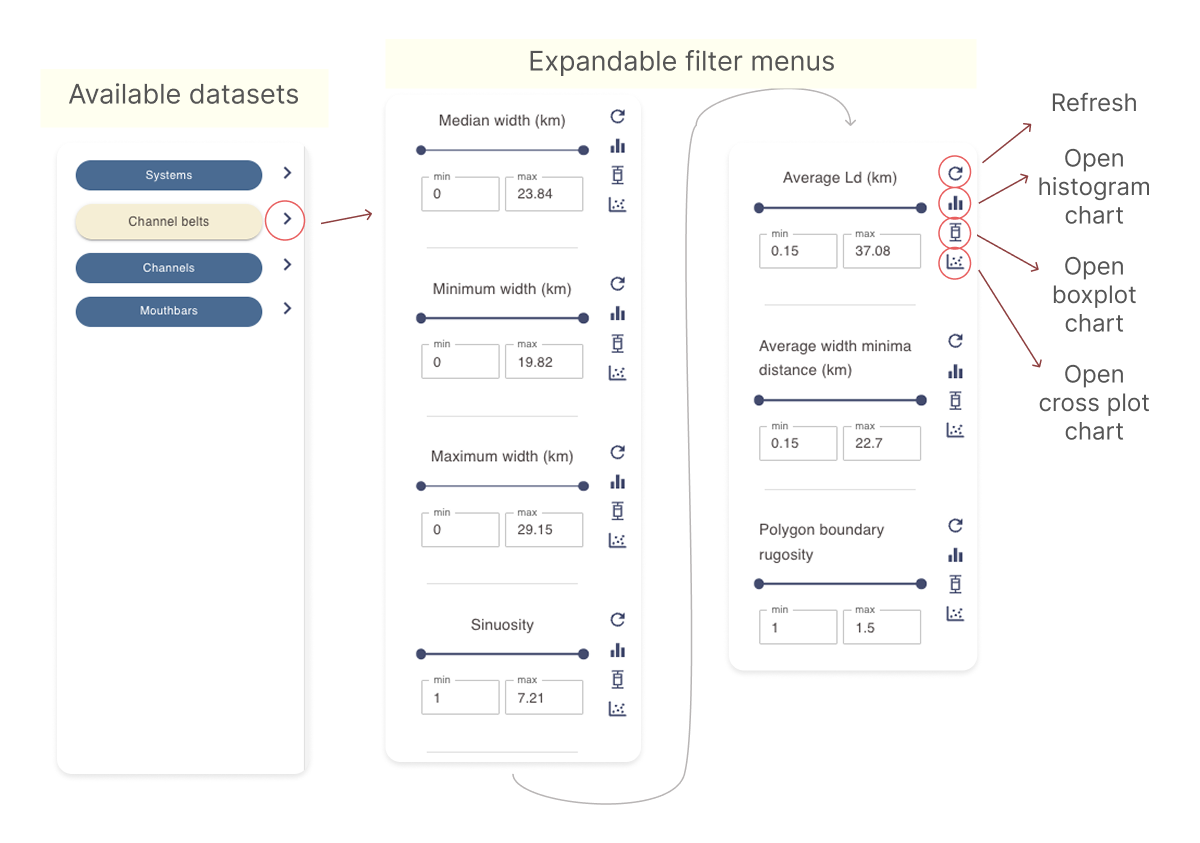
- In the filter sidebar, locate the Channel belts filter section.
- Active filter sections are highlighted in yellow.
- Click the Channel belts button to activate it if it isn’t already.
- Use the arrow next to the button to expand or collapse the filter submenu.
Filter section activation and the opening of filter menus are controlled independently.
- Select one or more filters as needed to narrow the channel belt search criteria. Only channel belt polygons that meet all selected criteria will appear in the results section.
- Use the slider or enter values in the min and max fields to define a range for each filter you would like to include in the query.
- Click the refresh icon next to a filter to reset it.
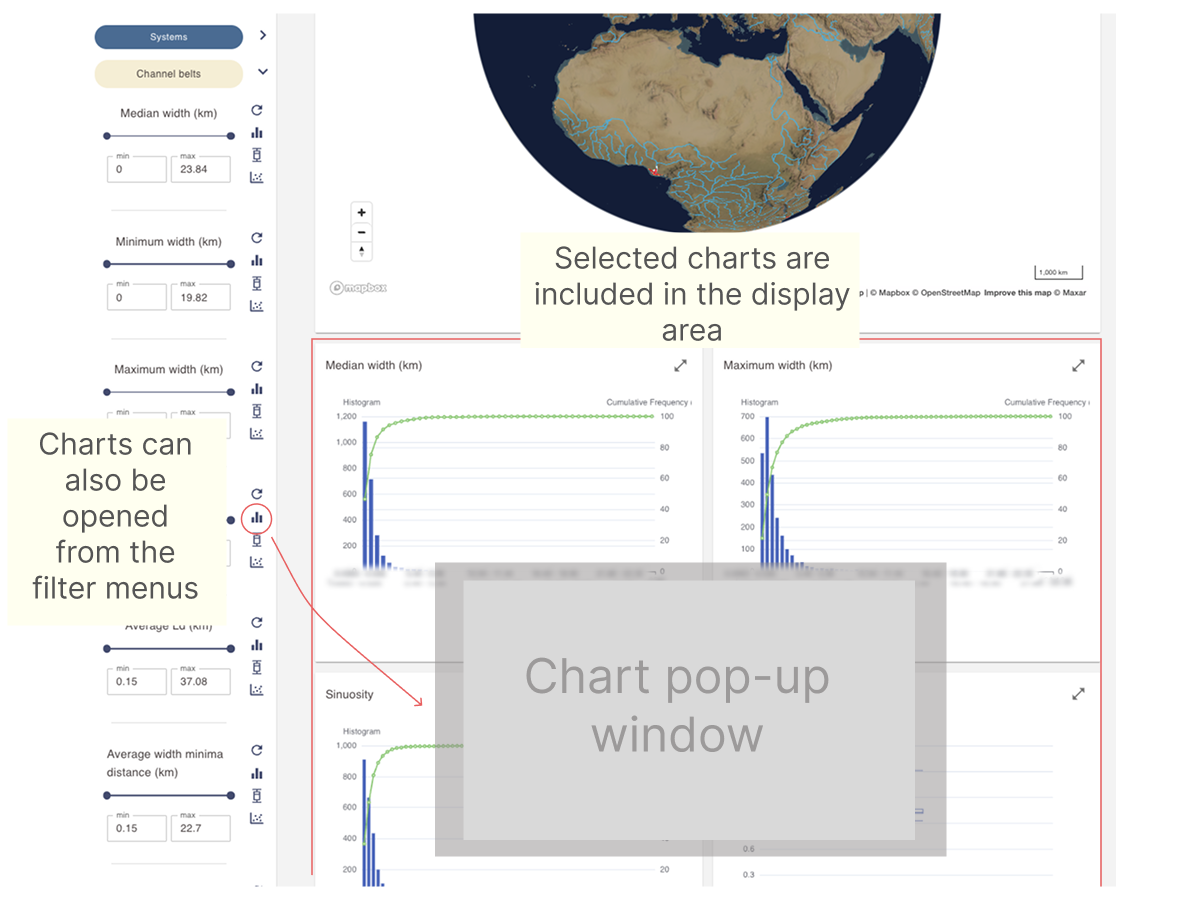
- use the histogram, box plot or scatter plot chart icons to open a pop-up window with an interactive chart based on the current selection. See Working with numerical data charts for more details.
Constrain channel belt analogues by parent system
The filter sidebar menu in the dashboard allows you to run complex queries by linking child datasets to parent datasets.
Selecting filters in the Systems while keeping the Channels section active, restricts the channel belt search to scenarios where all selected filters apply.
- Example: Activating process filters in the Systems section while viewing channel belt analogues will display only channel belt polygons associated with these systems.
Viewing and interacting with live maps
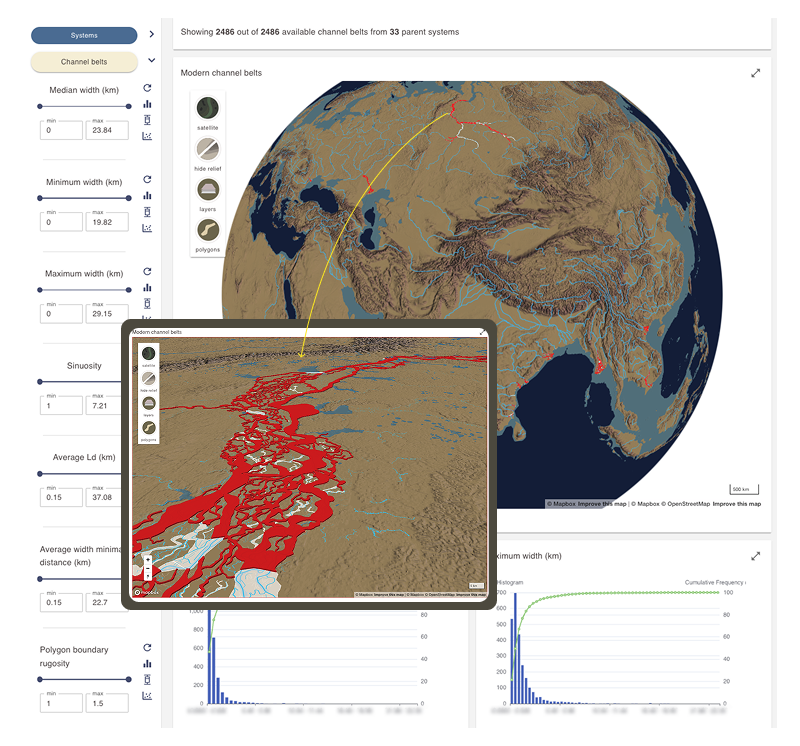
The results display area for the Channel belts section of the Analogue and dimensional data dashboard includes a dynamic map displaying channel belt polygons.
An information card above the map shows the number of active channel belt polygons and the number of systems from which they are derived.
Active channel belts are shown as red polygons on the map.
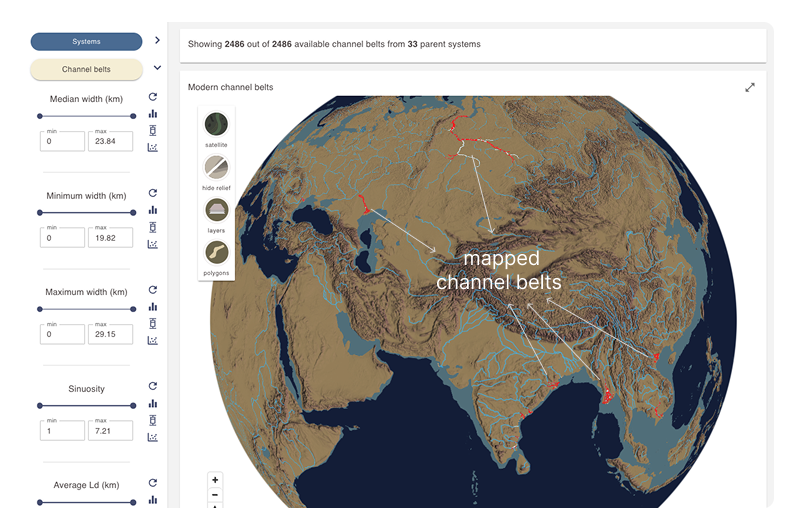
Move the globe map to view channel belt analogues. This is a dynamic map that can be moved, rotated, and tilted as desired.
- Left-click to pan the map
- Scroll with your mouse wheel to zoom in and out
- Hold the Alt key (Windows) or Control key (Mac) while moving your mouse to tilt and rotate the map
Map display controls
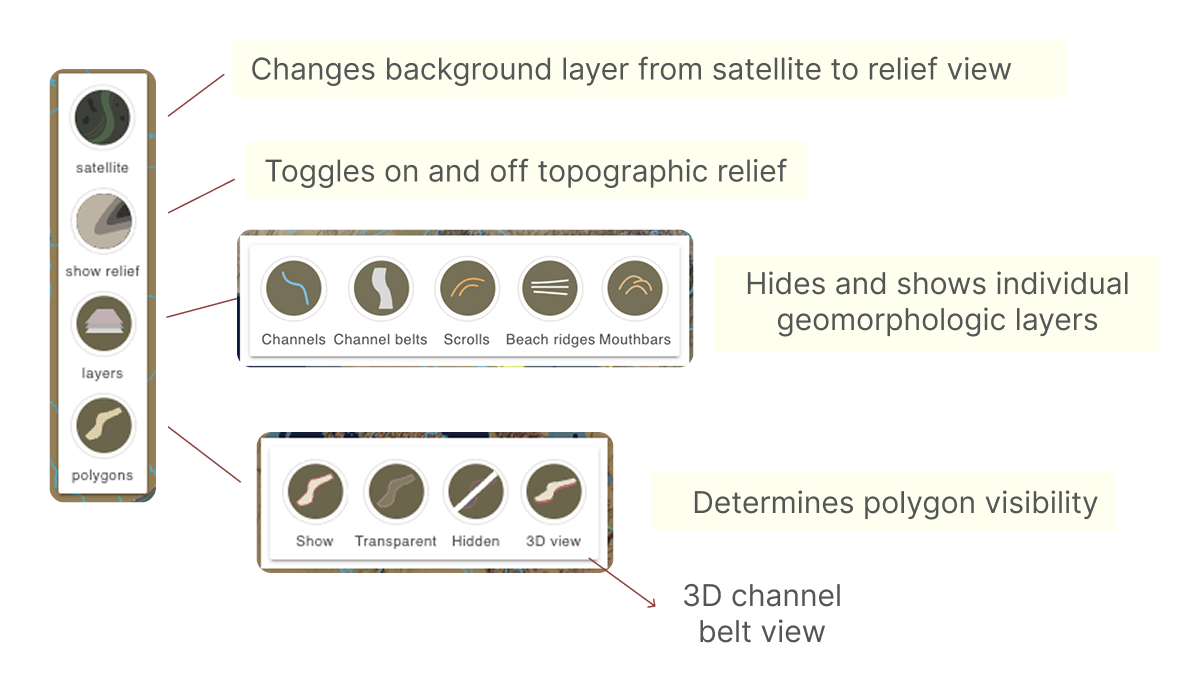
Use the buttons in the top-left corner of the map display area to manage the background layer, toggle geomorphological elements, and adjust the polygon display mode.
Channel belt analogues support a 3D view, accessible via the polygons display control button. Tilt the map for optimal visualization.
Viewing dimensional data and other numerical data charts
Channel belt metadata contains numerical dimensional data fields. These fields can be explored through interactive histograms, box plots, and scatter plots.
Refer to the page below for more information on working with these chart types.