Find mouth bar analogues and dimensional data
Identify modern, plan-view mouthbar analogues based on parent system characteristics and local coastal parameters (e.g., wave energy, tidal range). Analyze their distribution, size, and internal complexity in relation to variations in process regime and drainage type.
Obtain dimensional data for mouthbars in relation to parent depositional system parameters—such as shoreline process regime—and other relevant criteria.
Practical Uses
When using mapped mouthbars as depositional analogues:
When using mouthbar dimensional data:
Learn about the datasets:
Find out about how the modern mouthbar dataset was collected.
What you need to know
- The dimensional and shape data for mouthbar deposits is obtained from mapped polygons that are based on the development of smaller scale elements and element sets that can be identified in aerial images. These are mapped by identifying breaker zones in historical satellite imagery.
- The dimensions of mouth bar polygons represent the size of the sediment body at sea level (very shallow depth) that extends seaward from the river mouth. These deposits continue further underwater. Use information on progradational depth and clinoform angle to estimate the dip and strike extent of the entire sediment body. Additionally, deposits often extend further landward in the subaerial part of the delta lobe.
Find modern mouthbar analogue and dimensional data by using filter menus
- Open the View analogue and dimensional data dashboard.
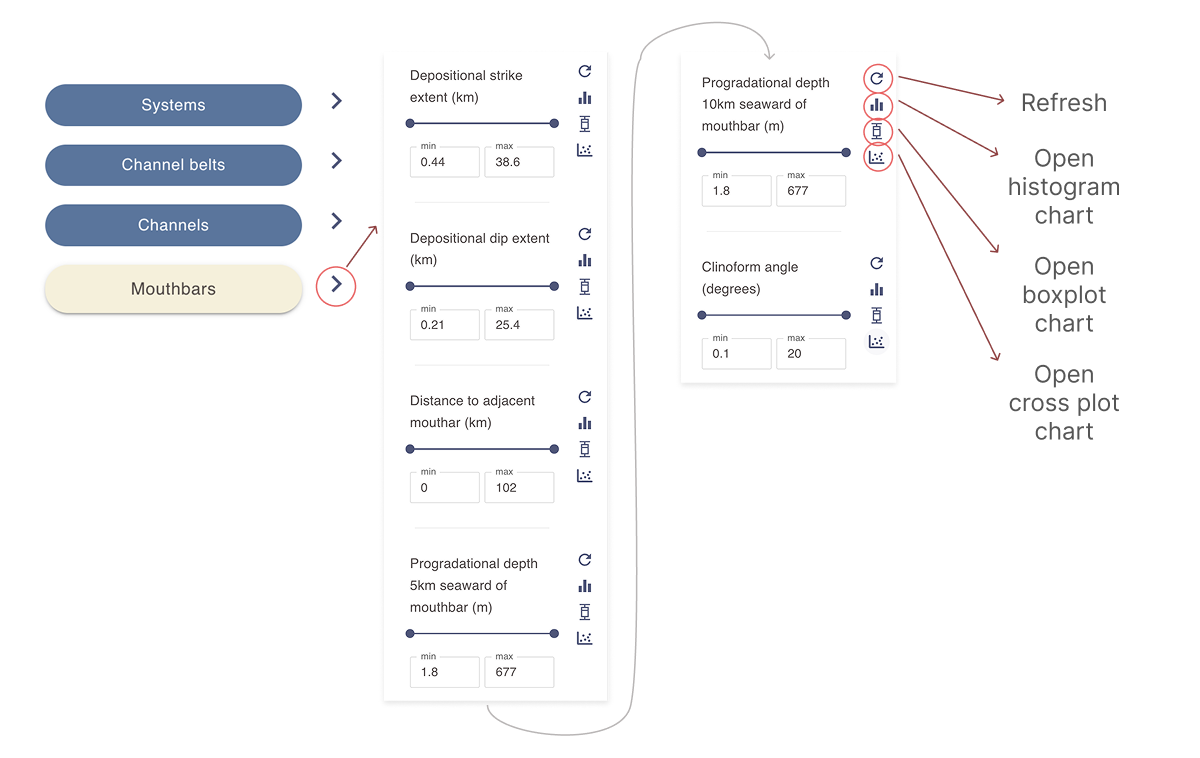
- In the filter sidebar, locate the Mouth bars filter section.
- Active filter sections are highlighted in yellow.
- Click the Mouthbars button to activate it if it isn’t already.
- Use the arrow next to the button to expand or collapse the filter submenu.
Filter section activation and the opening of filter menus are controlled independently.
- Select one or more filters as needed to narrow the mouthbar search criteria. Only mouthbar polygons that meet all selected criteria will appear in the results section.
- Use the slider or enter values in the min and max fields to define a range for each filter you would like to include in the query.
- Click the refresh icon next to a filter to reset it.
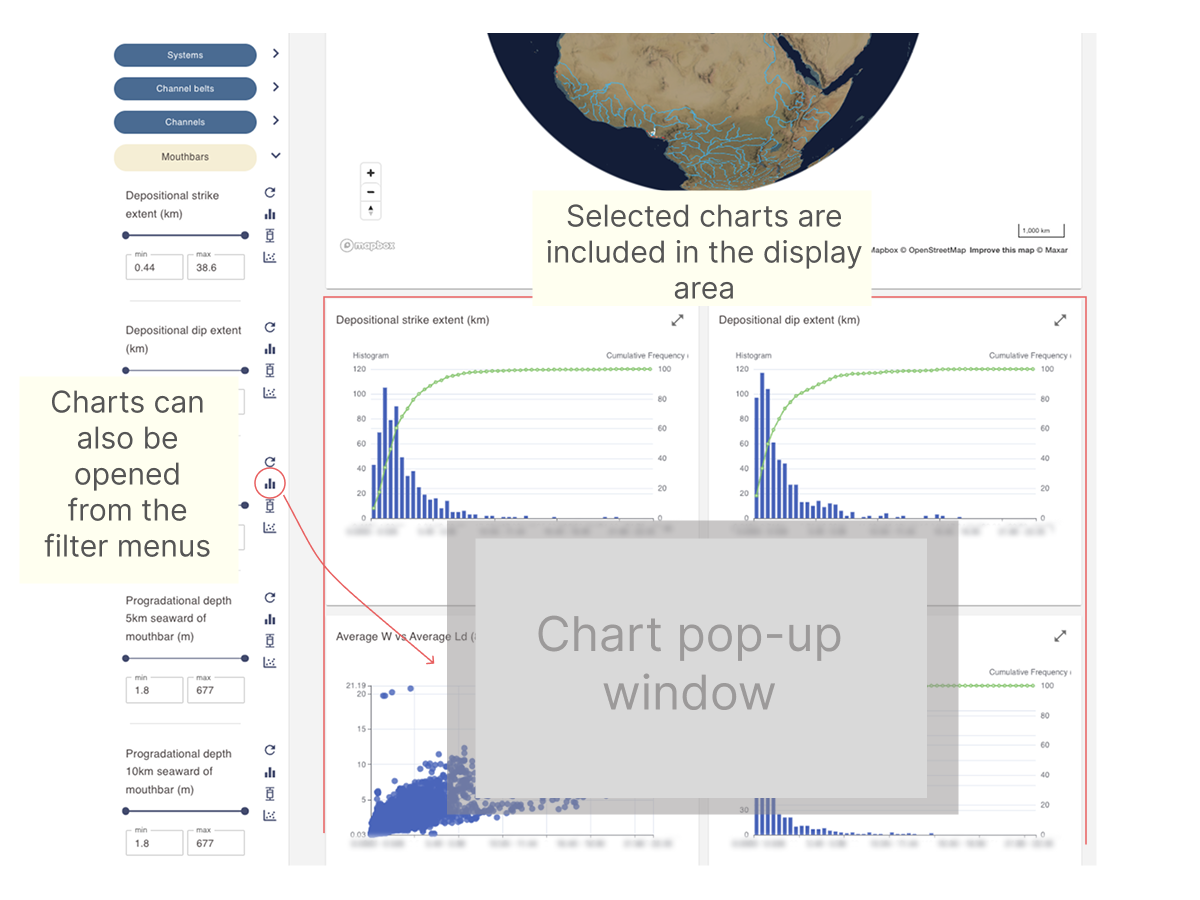
- use the histogram, box plot or scatter plot chart icons to open a pop-up window with an interactive chart based on the current selection. See Working with numerical data charts for more details.
Constrain mouthbar analogues by parent system
The filter sidebar menu in the dashboard allows you to run complex queries by linking child datasets to parent datasets.
Selecting filters in the Systems while keeping the Mouthbars section active, restricts the mouth bar search to scenarios where all selected filters apply.
- Example: Activating process filters in the Systems section while viewing mouthbar analogues will display only mouthbar polygons associated with these systems.
Viewing and interacting with live maps
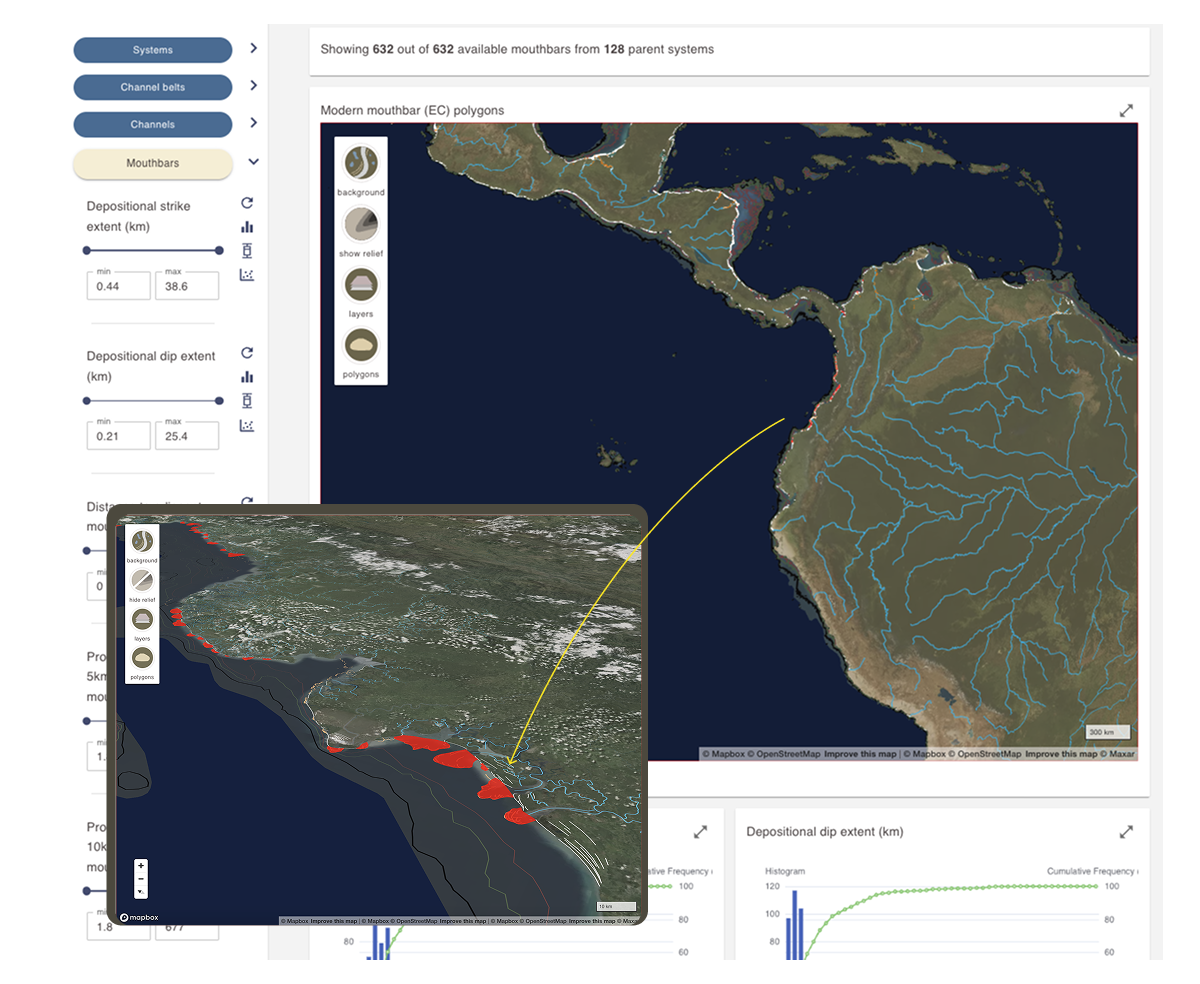
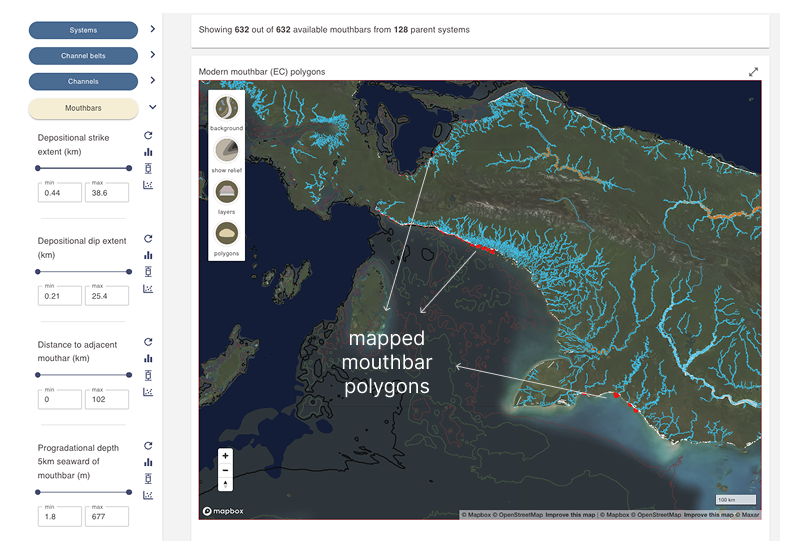
The results display area for the Mouthbars section of the Analogue and dimensional data dashboard includes a dynamic map displaying mouthbar polygons.
An information card above the map shows the number of active mouthbar polygons and the number of systems from which they are derived.
Active mouthbars are shown as red polygons on the map. Look for them along coastlines.
Move the globe map to mouthbar analogues. This is a dynamic map that can be moved, rotated, and tilted as desired.
- Left-click to pan the map
- Scroll with your mouse wheel to zoom in and out
- Hold the Alt key (Windows) or Control key (Mac) while moving your mouse to tilt and rotate the map
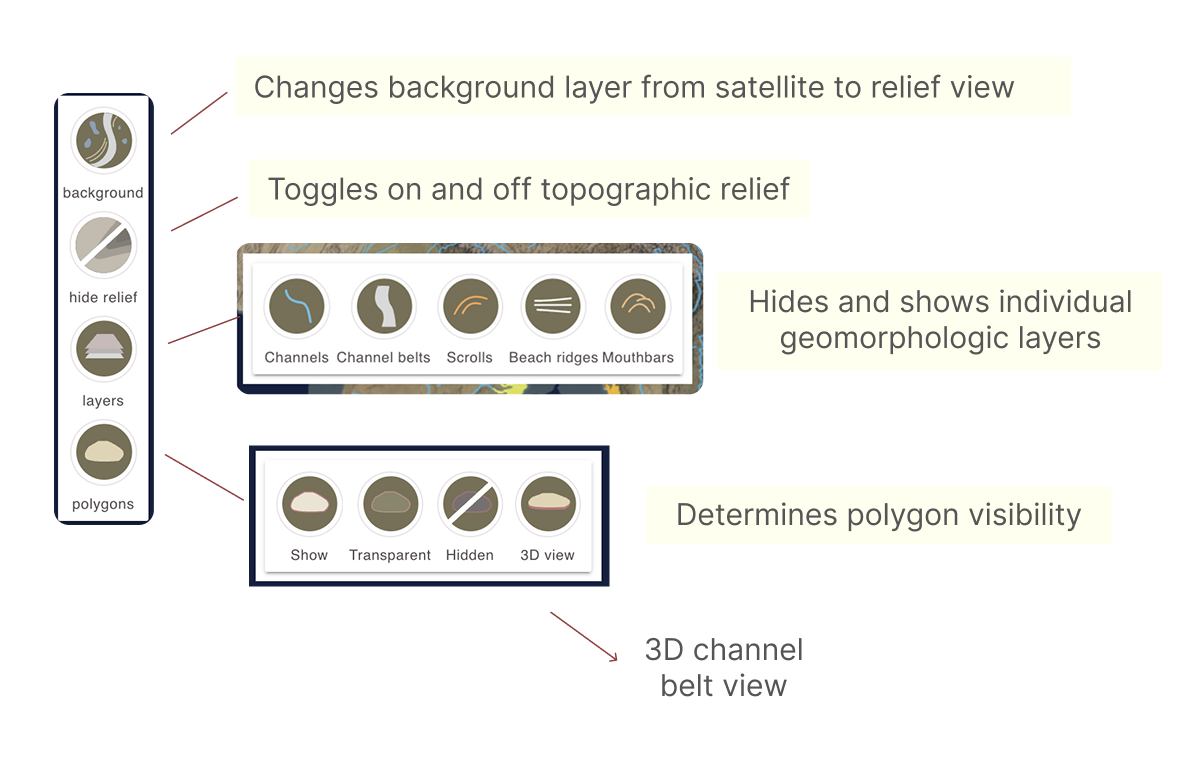
Map display controls
Use the buttons in the top-left corner of the map display area to manage the background layer, toggle geomorphological elements, and adjust the polygon display mode.
Viewing dimensional data and other numerical data charts
Moutbar metadata contains numerical dimensional data fields. These fields can be explored through interactive histograms, box plots, and scatter plots.
Refer to the page below for more information on working with these chart types.