Find system analogues
Identify system-scale Holocene depositional analogues using regional variables such as tectonic setting, physiography, drainage basin characteristics, and coastal depositional processes.
Select analogues that best match your subsurface interval, and refine depositional conceptual models by analyzing interactive, interpreted geomorphological maps.
Practical Uses
Learn about the datasets:
Find out about how the modern systems analogue dataset was collected.
Find regional-scale system analogues by using filter menus
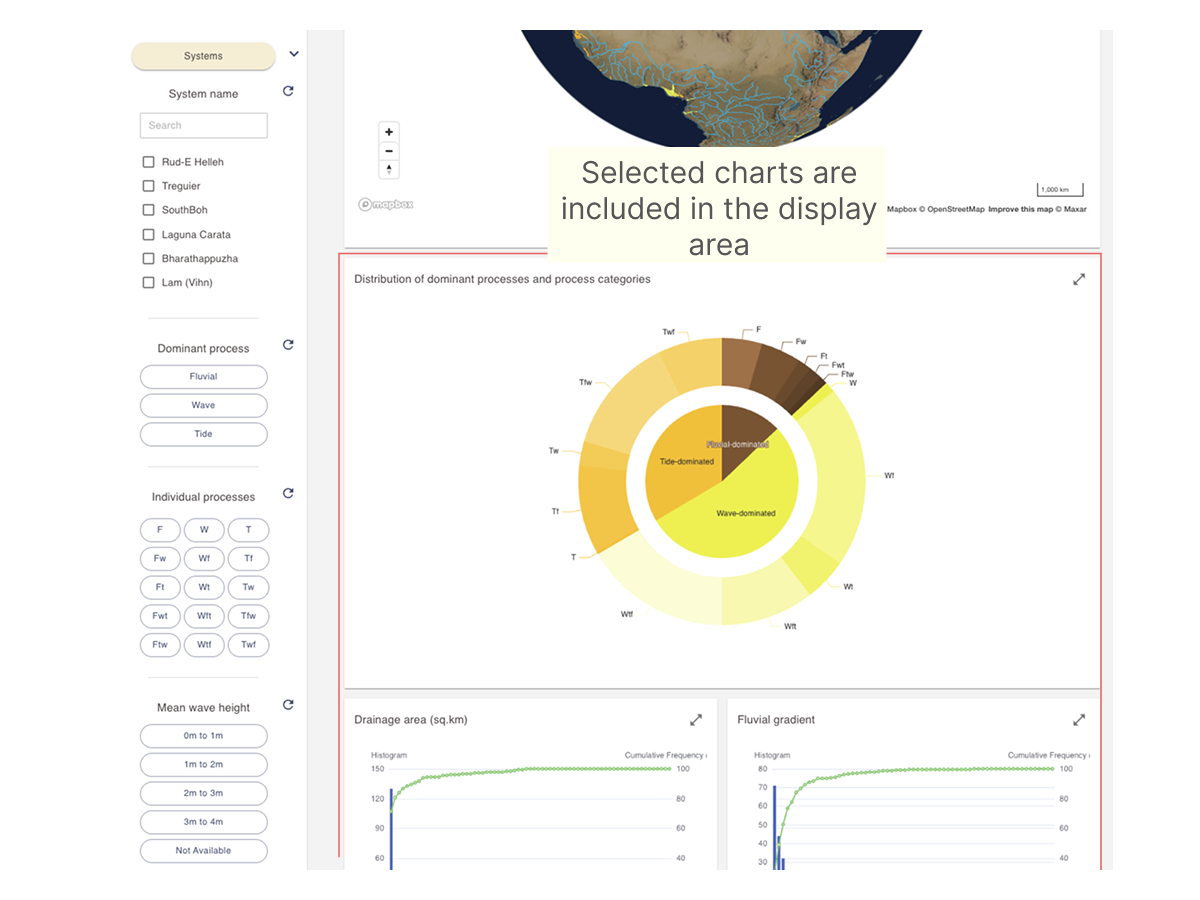
- Open the View analogue and dimensional data dashboard.
- In the filter sidebar, locate the Systems filter section.
- Active filter sections are highlighted in yellow.
- Click the Systems button to activate it if it isn’t already.
- Use the arrow next to the button to expand or collapse the filter submenu.
Filter section activation and the opening of filter menus are controlled independently.
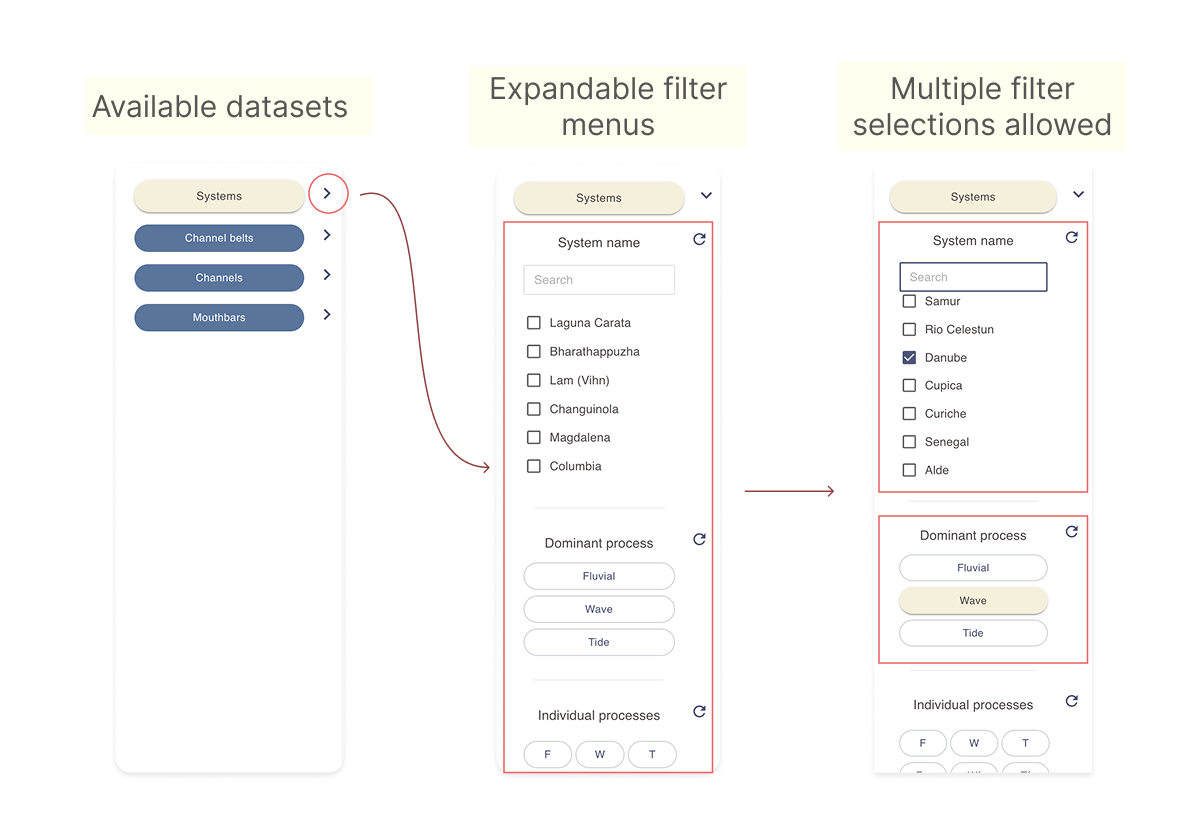
- Select one or more filters as needed to narrow the analogue search criteria. Only analogues that meet all selected criteria will appear in the results section.
- Use the search box in the System name filter to find a specific system. Select individual systems using the checkboxes.
- Use buttons in filters with distinct categories (e.g., Dominant process, Individual processes).
- For numerical filters, use the slider or enter values in the min and max text fields to define a range.
- Additional filter controls:
- Click the refresh icon next to a filter to reset it.
- use the histogram, box plot or scatter plot chart icons to open a pop-up window with an interactive chart based on the current selection. See Working with numerical data charts for more details.
Viewing and interacting with live maps
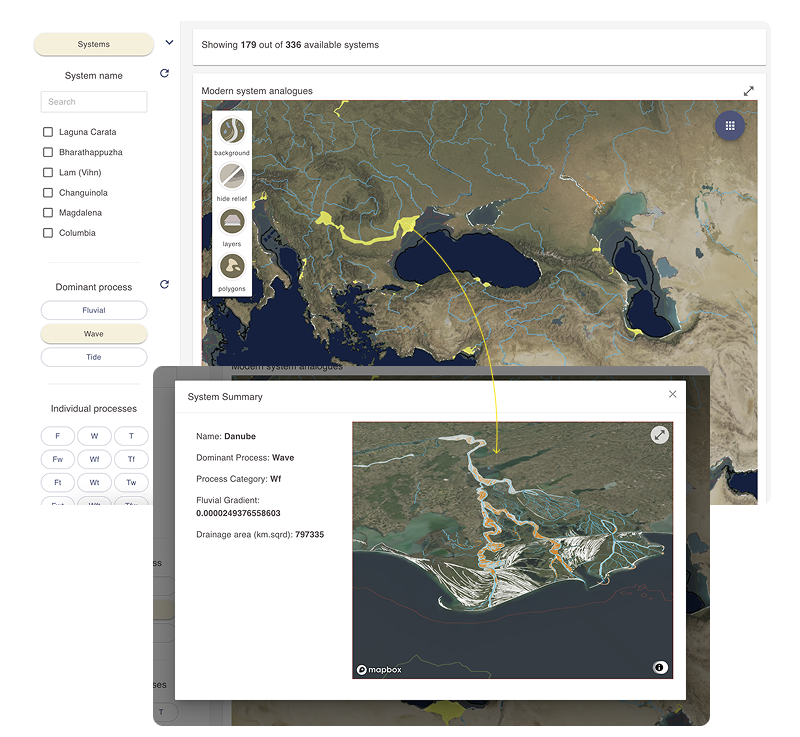
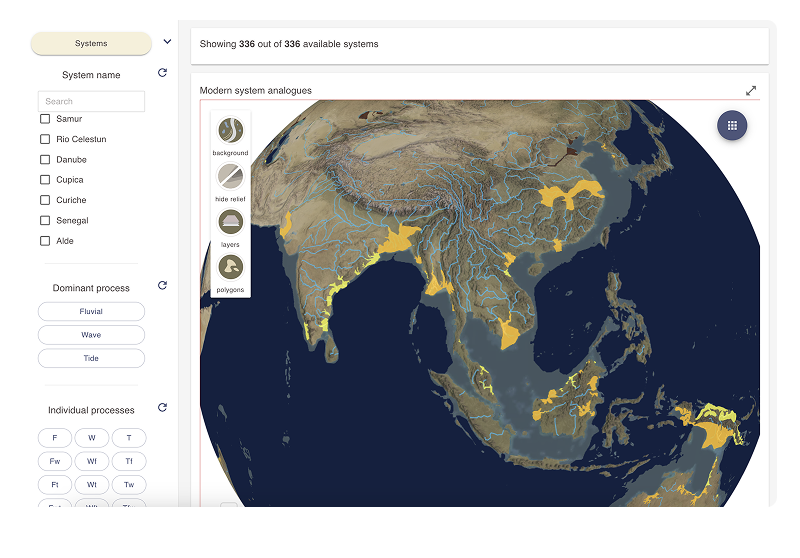
The results display area of the Analogue and Dimensional Data dashboard includes a dynamic map that presents analogue information.
An information card above the map shows the current number of active systems.
1. Interacting with the main map area
System analogues that match the selected filter criteria are displayed as color-coded polygons:
- Yellow – wave-dominated systems
- Orange – tide-dominated systems
- Brown – fluvial-dominated systems
- Move the globe map to view analogues. This is a dynamic map that can be moved, rotated, and tilted as desired.
- Left-click to pan the map
- Scroll with your mouse wheel to zoom in and out
- Hold the Alt key (Windows) or Control key (Mac) while moving your mouse to tilt and rotate the map
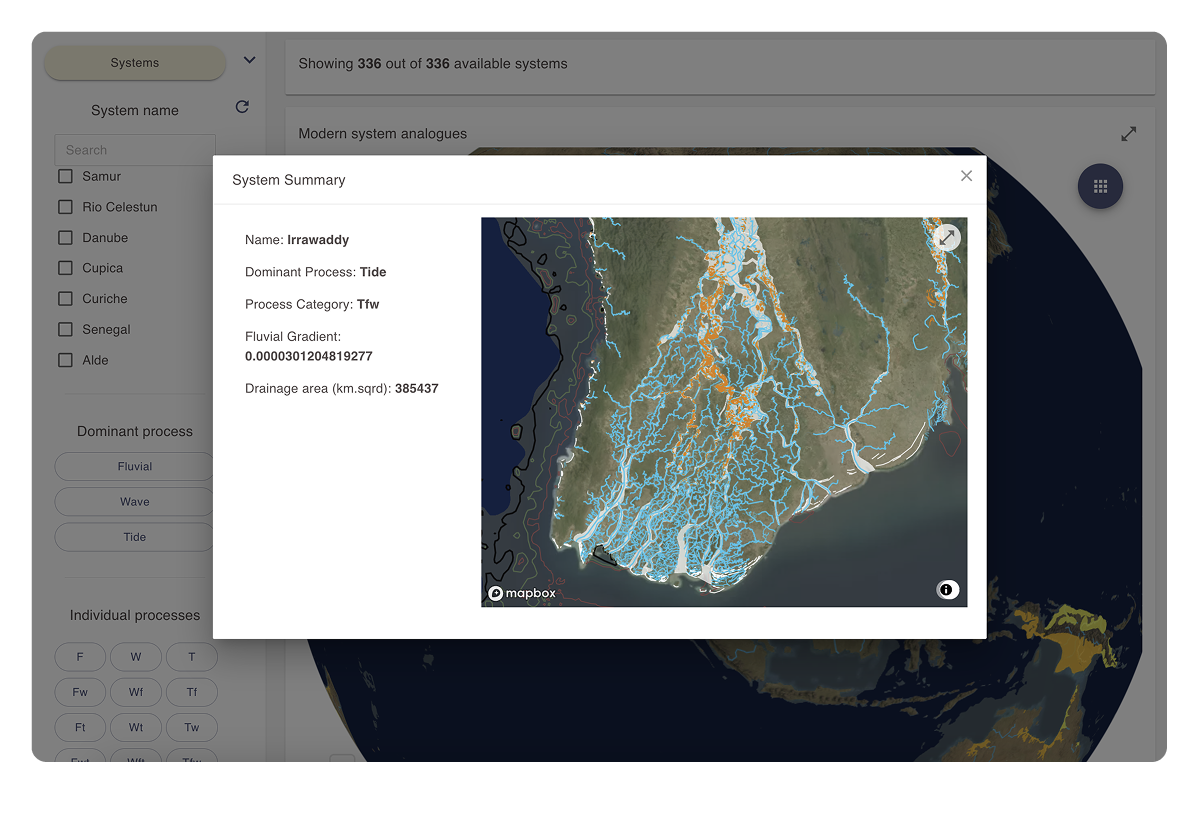
- Click on a system polygon to open a pop-up information box. Use the information box to view key details about the system and to examine its geomorphology.
The map within the information box is interactive—it can be zoomed, tilted, and rotated.
-
Click the expand icon in the top right corner of the map to open the map in full-window mode.
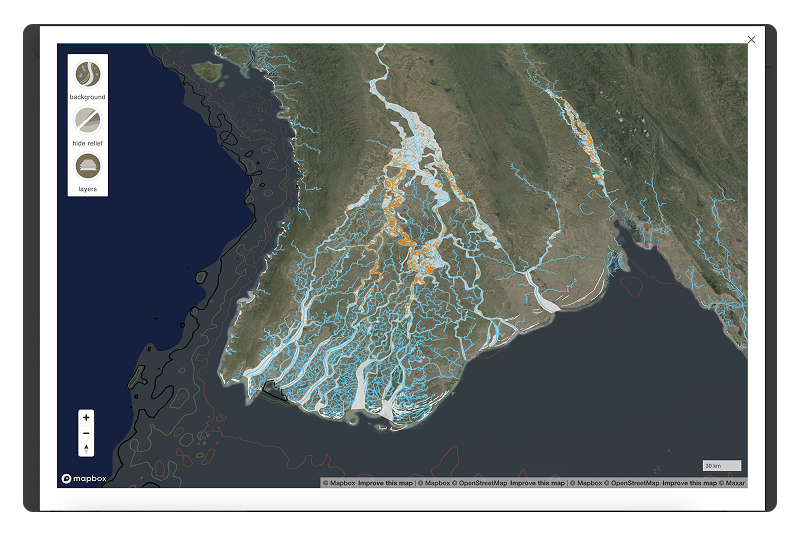
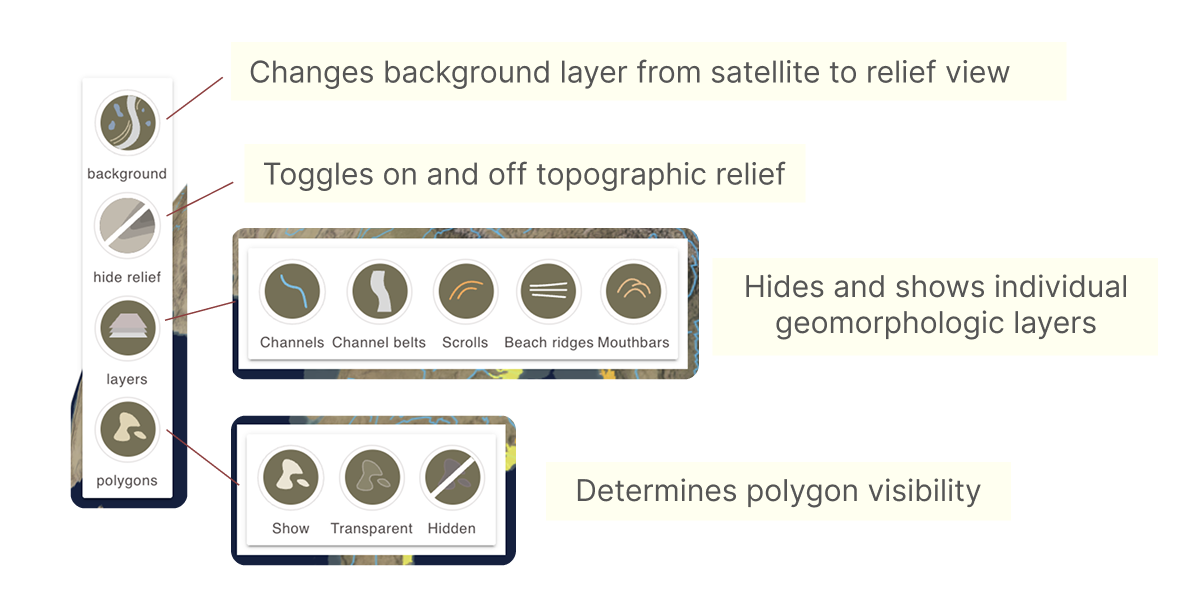
2. Map display controls
Use the buttons in the top-left corner of the map display area to manage the background layer, toggle geomorphological elements, and adjust the polygon display mode.
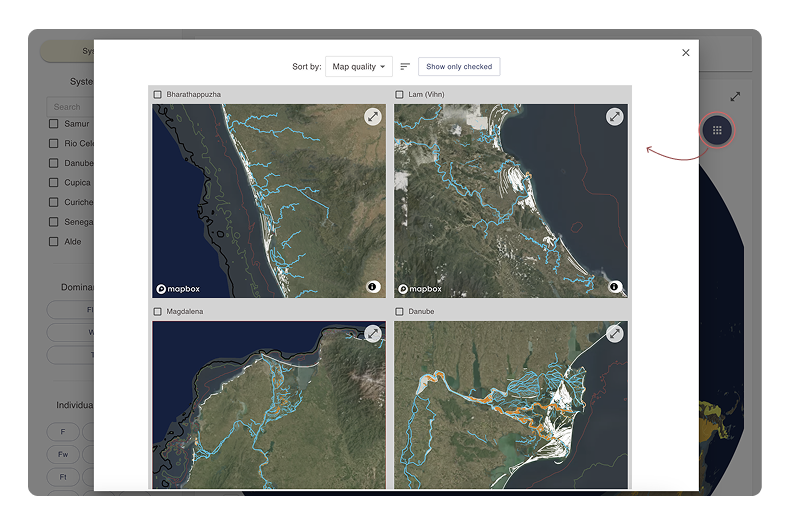
3. Working with the system grid map view
Use the Grid view to visually compare, sort, and select individual systems to build collections of suitable analogues.
This is the most convenient way to easily compare an contrast a number of analogue systems.
-
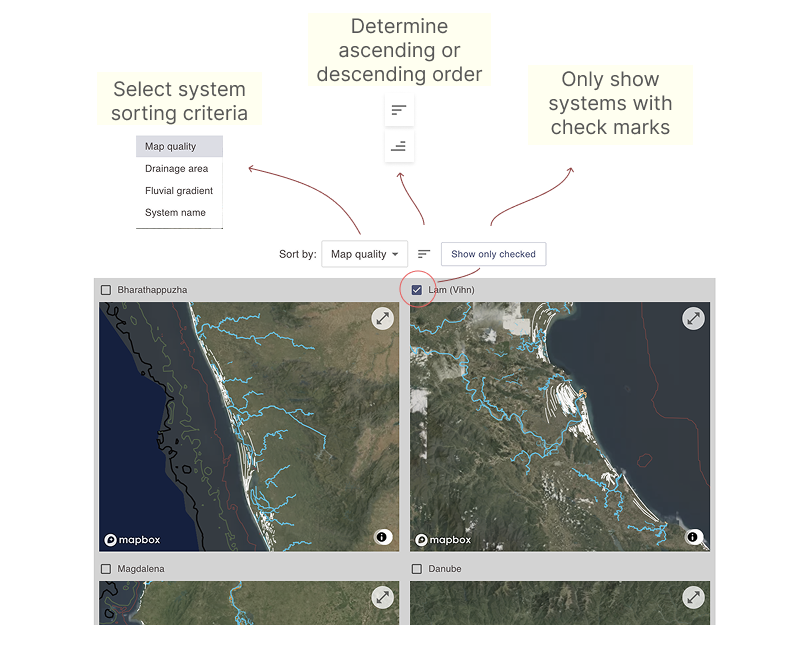
Use the map controls at the top of the grid map pop-up window to set map ordering criteria, set ascending or descending ordering, and choose whether to display only systems with checkmarks.
-
Scroll through the systems and use the checkmarks to select suitable analogues. Click the Show only checked button to display only the selected maps.
These are live maps that you can zoom and tilt
Adding checkmarks in the map grid view also updates the corresponding selections in the System Name filter. This acts as a selection filter based on those systems and will affect all map and numerical chart displays accordingly.
Viewing numerical data charts
Analogue filter metadata may include numerical fields. These fields can be explored through interactive histograms, box plots, and scatter plots.
Refer to the page below for more information on working with these chart types.